Bitcoin Rally Incoming: This Major BTC Metric Just Turned Bullish Once Again
A crucial Bitcoin metric has just turned bullish, sparking optimism from a crypto analyst regarding an impending rally for Bitcoin. This unique technical pattern suggests that the world’s largest cryptocurrency could see...
Archive context
Older archive item. Useful for background and entity history, but not a fresh market-moving signal.

A crucial Bitcoin metric has just turned bullish, sparking optimism from a crypto analyst regarding an impending rally for Bitcoin. This unique technical pattern suggests that the world’s largest cryptocurrency could see its price ascending further, potentially kick-starting a highly welcomed bull run this cycle.
Bitcoin Technical Pattern Flips BullishBitcoin’s price has often followed distinct historical patterns, with the majority of these indicators preceding significant rallies or bearish trends. One of the most compelling signs that Bitcoin may be turning bullish again is seen as the Stablecoin Supply Ratio (SSR) Oscillator breaks below the lower Bollinger Bands, a technical indicator used to measure a market’s volatility and momentum.
According to a crypto analyst identified as ‘Dominando Cripto’ on X (formerly Twitter), the SSR is a unique technical tool designed to evaluate the market sentiment by comparing the supply of stablecoins to Bitcoin. This tool is used by analysts and traders to identify buying and selling opportunities for Bitcoin. Additionally, it quantifies how the 200-day Simple Moving Average (SMA) of the SSR moves within the Bollinger Bands.
Dominando Cripto has provided an in-depth explanation of how the SSR oscillator is calculated and how to interpret its signals for identifying bullish trends.
“The oscillator is calculated by taking the difference between the current Stablecoin Supply Ratio value and its 200-day Simple Moving Average (SMA), then dividing it by the standard deviation of the SSR over the same period,” the analyst stated.
Sharing a price chart depicting movements of the SSR oscillator, the crypto analyst suggests that when the oscillator moves above the upper Bollinger Bands, it suggests that the SSR is significantly higher than normal levels. This indicates that stablecoins are dominating the market, signaling bearish sentiment and a potential downturn for Bitcoin.
Conversely, when the oscillator falls below the lower Bollinger Band, it indicates that the SSR is low, highlighting the reduced dominance of stablecoins and signaling bullish sentiment that could potentially trigger an incoming rally in Bitcoin.
In the above price chart, Dominando Crypto pinpointed several instances when the SSR oscillator displayed bearish and bullish sentiment, identifying these periods as heated zones and cold zones, respectively. Recent market movements indicate that the SSR oscillator is in the cold zone, indicating a potential bullish outlook for Bitcoin.
More Bullish Signs For BTCOn May 18, Blockchain analytics platform, Santiment, revealed a new market trend where small traders are consistently liquidating their BTC holdings, even as the cryptocurrency has shown positive performance lately.
The analytics platform noted that historically, when small wallets dump coins into larger wallets, it is considered an encouraging sign for Bitcoin, indicating a potential bullish turnaround for the pioneer cryptocurrency.
At the time of writing, Bitcoin’s price is trading at $66,955, according to CoinMarketCap. The cryptocurrency has been on a major bullish momentum recently, witnessing an 8.94% increase in the last seven days and a 4.25% surge over the past month.
Why this matters
This bitcoin story adds another data point to the current market tape and is useful when read alongside nearby source coverage.
Original source
Read on NewsBTCRelated market context

Bitcoin Price Today: BTC Outperforms S&P 500 Above $80K as Fed Interest Rate Decision Looms
Bitcoin was hovering near $81,412 in the latest TradingView readings provided for October 28, keeping the $80,000 level in focus a...

Zcash (ZEC) Price Prediction: Whale Goes Long Before FOMC Announcement as H&S Pattern Puts $1,350 in Focus
Traders are watching whether Zcash price can break above $1,350, potentially confirming a bullish chart pattern and opening the wa...

Microsoft Copilot AI Predicts a Historic BTC Move Post-FOMC
Microsoft Copilot AI predicts a wildly unimaginable move for Bitcoin (BTC USD) could be in play starting this week, after the Fede...

Cardano Price Prediction: Whale Activity Jumps as $0.20 Support Sets Up a Potential Move Toward $0.26
Cardano price is trading close to an important support area after another volatile stretch, with price action now beginning to att...
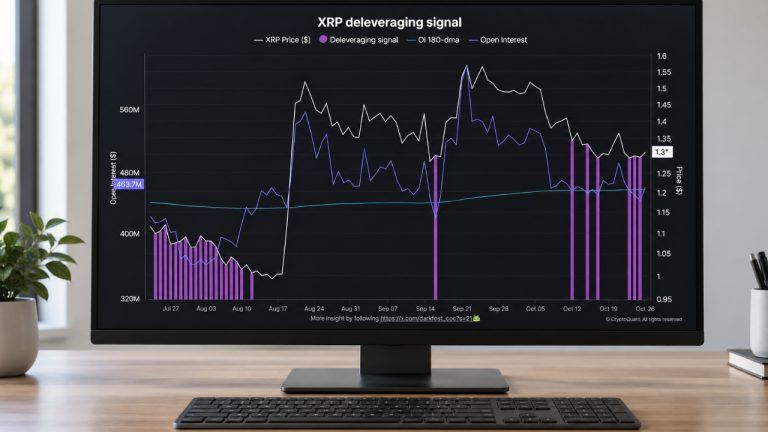
XRP Flashes Signal Seen Before 72% Rally as Binance Leverage Falls
XRP has flashed a deleveraging signal that previously preceded a 72% rally, according to an analysis shared by Cryptoquant. Fallin...

Bitcoin Price “Climbing the Wall of Worry” – Early Signs of Bull Market | Michael Sullivan
▶Bitcoin Magazine Bitcoin Price “Climbing the Wall of Worry” – Early Signs of Bull Market | Michael Sullivan Bitcoin is holding ne...