Bitcoin Supply In Loss Turns Upward—Early Bear Market Signal?
On-chain data shows the Bitcoin Supply in Loss indicator has witnessed a shift in direction that has often led into bearish phases in past cycles. 365-Day SMA Of The Bitcoin Supply In Loss Has Been Rising Recently As poi...
Archive context
Older archive item. Useful for background and entity history, but not a fresh market-moving signal.

On-chain data shows the Bitcoin Supply in Loss indicator has witnessed a shift in direction that has often led into bearish phases in past cycles.
365-Day SMA Of The Bitcoin Supply In Loss Has Been Rising RecentlyAs pointed out by an analyst in a CryptoQuant Quicktake post, the Bitcoin Supply in Loss has started to trend up again. This metric measures, as its name suggests, the percentage of the total BTC circulating supply that’s currently being held at some net unrealized loss.
The indicator works by scanning through the transaction history of each token in circulation to determine the price at which it was last transacted on the network. If this previous transaction value for any coin was greater than the latest spot price, then the metric assumes that particular token to be underwater.
The Supply in Loss adds up all coins falling in this category and finds what part of the supply they make up for. A counterpart metric known as the Supply in Profit tracks the supply of the opposite type. Since the total supply must add up to a 100%, however, the Supply in Profit is simply equal to the Supply in Loss subtracted from 100.
Now, here is a chart that shows the trend in the 365-day simple moving average (SMA) of the Bitcoin Supply in Loss over the cryptocurrency’s history:
As displayed in the above graph, the 365-day SMA Bitcoin Supply in Loss plummeted to the lowest point for the cycle back in October. This plunge came as the asset rallied to a new all-time high (ATH) beyond the $126,000 level.
Since the low, however, the indictor has witnessed a rapid climb, a consequence of the bearish momentum that BTC has faced following its ATH. So far, the indicator hasn’t risen to a significant level compared to past capitulation levels, but the change in direction has been solidifying itself.
“Historically, this shift has marked the early phase of bear markets, when losses begin to spread beyond short-term holders and gradually reach longer-term participants,” explained the quant. From the chart, it’s visible that bearish transitions in past cycles occurred as the indicator shot up, with a high value in it coinciding with the cycle bottom.
Whether the recent reversal in the Supply in Loss is the beginning of something similar only remains to be seen. Earlier in this cycle, an upward turn in the indicator ended up only being temporary, as the H1-2025 drawdown gave way to renewed bullish momentum rather than a prolonged bear phase.
BTC PriceAt the time of writing, Bitcoin is trading around $89,000, up over 1% in the last 24 hours.
Why this matters
Bitcoin is a tracked market entity in the DigitalMoneyBox archive, making this useful context for readers monitoring repeated mentions and follow-up coverage.
Original source
Read on NewsBTCRelated market context

Bitcoin enters bearish phase as demand shrinks, traders face 20% losses
The bearish phase in Bitcoin highlights the volatility and risks in cryptocurrency investments, impacting trader confidence and in...
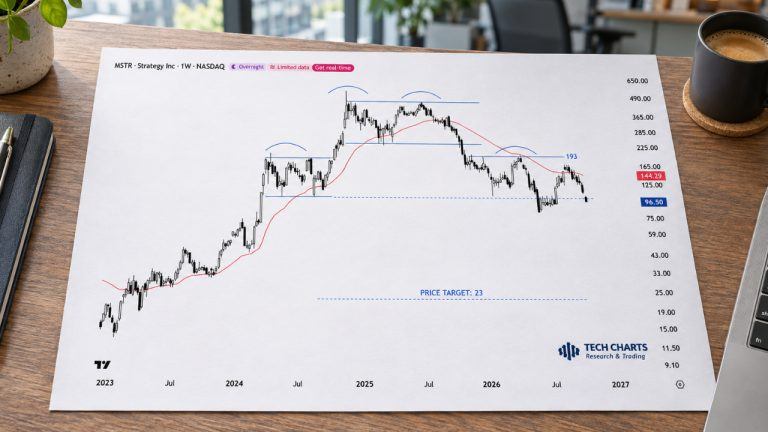
Bitcoin Giant Strategy’s Shares Could Drop 75% to $23 Amid Bearish Pattern: Analyst
Strategy shares have already lost 44% in six months, yet a new analysis sees a potential fall toward $23 for the $53 billion bitco...

Crypto News Today: BTC Faces Miner Sell-Off, ETH Open Interest Rises, and XRP Faces Derivatives Pressure
Glassnode reports that public Bitcoin miners have sold nearly half of their tracked BTC reserves since January 2026. Meanwhile, Bi...

‘Gift from the market’: Bitcoin shows signs of a local bottom after six weeks of losses, analyst says
K33 said bitcoin may have found a local bottom after six weekly losses, with options traders still seeking downside protection.

Swiss Bank Sygnum Says Bitcoin Could Reach New High Near $128,000
Bitcoin Magazine Swiss Bank Sygnum Says Bitcoin Could Reach New High Near $128,000 Sygnum Bank estimates that bitcoin could reach...

CryptoQuant says bitcoin is back in a bearish phase but has reached a ‘value zone’
Bitcoin has dipped below its 200-day and 365-day moving averages of $72,900 and $75,900, respectively, CryptoQuant said.