Bitcoin Trend Strength Exhibits Striking Similarities With Last Bull Run
Bitcoin price is above $45,000 for the first time since April 2022 and according to the weekly Average Directional Index, the rally might not be stopping anytime soon. That’s because the trend strength measuring tool is...
Archive context
Older archive item. Useful for background and entity history, but not a fresh market-moving signal.

Bitcoin price is above $45,000 for the first time since April 2022 and according to the weekly Average Directional Index, the rally might not be stopping anytime soon. That’s because the trend strength measuring tool is beginning to show shocking similarities with the 2021 bull run.
Bitcoin Bull Run Deja Vu: 2021 Versus 2024When Bitcoin is trending, it is wise to get out of the way. The same is true regardless of whether or not BTCUSD is in an uptrend or a downtrend. Currently, the top cryptocurrency by market cap is in an uptrend, according to the Average Directional Index.
The tool is designed to measure the strength of a trend on any timeframe. When the ADX is growing and rises above 20, it suggests there is an active trend in play. Below 20, and there isn’t enough evidence of a trend, which could suggest sideways price action.
Not only is the weekly ADX in Bitcoin above 20, but is is above 51. Reaching above 51 in late 2020, resulted in four-week-long 120% push higher. If the same magnitude move follows, BTCUSD could hit $94,000 per coin by mid-February.
All About The Average Directional IndexThe Average Directional Index is a trend-strength measuring tool designed by J. Welles Wilder, Jr., the creator of other technical analysis tools such as
The ADX reading in dark blue above shows the strength of a trend. The ADX, however, comes equipped with two Directional Indicators, the DI+ and DI-. Not only is the ADX in the exact location of the late 2020, early 2021 bull run, but the DI+ in green and DI- in red are also at the same level.
This could hint at the same ripe conditions for a parabolic rally. In 2021, Bitcoin peaked when the ADX reached 85 and began to tumble back downward. If BTCUSD exceeds this level, we could be looking at an even stronger rally than expected.
If it fails to reach above 85, yet sets a new all-time high, a bearish divergence could warn of an impending top in crypto. Whatever the case may be, the ADX could be an important tool in understanding cryptocurrency trends.
Why this matters
This bitcoin story adds another data point to the current market tape and is useful when read alongside nearby source coverage.
Original source
Read on NewsBTCRelated market context

Doomberg: US Treasury Sanctions are “Wildly Bullish” for Bitcoin & Gold
▶Bitcoin Magazine Doomberg: US Treasury Sanctions are “Wildly Bullish” for Bitcoin & Gold What happens to reserve assets when you’...

Binance Hack: Are Funds Safu? What We Know So Far About the Biggest Heist in Crypto History
Cryptocurrency giant Binance faces what could be the largest exchange hack in history after a security breach affected an estimate...

Mike Flaum: MSTR Performance “Massively” to the Upside During Next BTC Bull Run
▶Bitcoin Magazine Mike Flaum: MSTR Performance “Massively” to the Upside During Next BTC Bull Run Mike Flaum, CEO of Log Scale Inv...
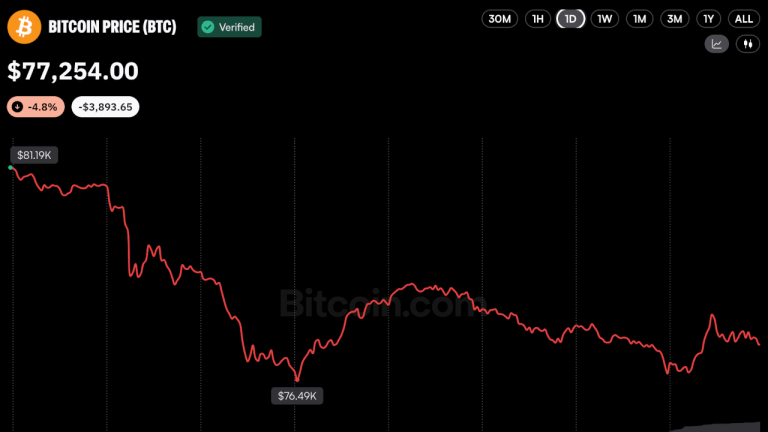
Bitcoin Price Rebounds Above $77K, but Binance Hack Keeps Traders on Edge
Bitcoin stabilized above $77,000 after a $6.3 billion Binance hack triggered a marketwide sell-off, pushing the cryptocurrency to...

Crypto Fear & Greed Index drops to 29 as Bitcoin falls to $77,000
The drop in the Crypto Fear & Greed Index highlights market volatility, signaling potential buying opportunities amid broader mark...

Trust Wallet to strengthen defenses after Binance, Polymarket attacks
Trust Wallet's proactive security upgrades highlight the increasing importance of addressing AI-driven threats in the crypto indus...