Bitcoin’s Most Reliable Signal Just Flashed—Next Stop: $170,000
The Hash Ribbon “buy” trigger – a signal embedded in Bitcoin’s network hashrate dynamics – has flashed again, and technical analyst Astronomer Zero believes it could pave the way to at least $170,000 per coin. A chart th...
Archive context
Older archive item. Useful for background and entity history, but not a fresh market-moving signal.

The Hash Ribbon “buy” trigger – a signal embedded in Bitcoin’s network hashrate dynamics – has flashed again, and technical analyst Astronomer Zero believes it could pave the way to at least $170,000 per coin. A chart the analyst posted on X on 12 June overlays every prior weekly‐time-frame Hash Ribbon entry since 2020 on the BTC/USDT perpetual contract at Binance, illustrating why the signal is treated with almost talismanic respect by some quantitative traders.
Bitcoin Surge To $170,000 Imminent?The graphic shows five earlier occurrences of the capitulation-to-recovery crossover embedded in the Hash Ribbon algorithm. Each is marked on the price pane by a cobalt-blue “Buy” dot directly beneath the weekly candles and linked to the ensuing rally by a violet measuring arrow.
After the signal in late-2020, Bitcoin accelerated by 235% from the $18,000 consolidation floor to challenge the then-all-time-high zone just above $60,000 before any major pull-back unfolded. Mid-2021’s ribbon event proved more modest – roughly 59% from a $30,000 base into resistance near $48,000 – yet it still respected the rule that the market rewards the crossover with significant upside.
The next two signals, printed in late-2022 and early-2023, were far stronger: a 260% surge from the capitulation trough below $18,000, followed by a 175% leg in mid-2023 that carried price cleanly to the long-standing supply shelf in the $60,000 area. In mid-2024, the hash ribbon signal led to a 100% rally above $100,000.
Most recently, the ribbon crossed again three weeks ago, with Bitcoin quoted at roughly $105,000 on the weekly close. The analyst annotates current price at $106,873 and draws a fresh horizontal barrier at the $160,000–$165,000 band – the level that would align with the mean magnitude of earlier post-signal advances. Were the market merely to match the smallest historical percentage move (≈ 60%) from the present crossover, spot would extend to the $170,000 region indicated in crimson on the chart.
Hash Ribbon logic is mechanical. When the 30-day moving average of network hashrate climbs back above the 60-day average after a period of miner capitulation, on-chain observers read it as an all-clear that forced selling pressure has exhausted. In the past, that transition has coincided with aggressive spot accumulation visible on-chain and in derivatives positioning.
Sceptics will note that correlation is not causation and that a six-figure quote for Bitcoin already bakes in ETF inflows, a looming halving supply shock and a global liquidity cycle that could yet tighten. Still, Astronomer Zero’s chart underscores an objective fact: in the last half-decade the Hash Ribbon “buy” has never mis-fired. Whether history’s rhythm repeats or merely rhymes, traders are watching the $170,000 level marked on the chart as the next test of that record.
At press time, BTC was down 3.1% over the past 24 hours, trading at $104,898.
Why this matters
This bitcoin story adds another data point to the current market tape and is useful when read alongside nearby source coverage.
Original source
Read on NewsBTCRelated market context

Ether options signal growing downside fears as Bitcoin stays resilient, analyst says
Growing downside fears in Ethereum may signal broader market anxiety, potentially impacting investor confidence and risk appetite...

JPMorgan Picks Ethereum for JPM Coin, Citing the Network’s Liquidity and Client Use
JPMorgan is launching JPM Coin, its dollar deposit token, on Ethereum and will offer it to the bank’s institutional clients there,...
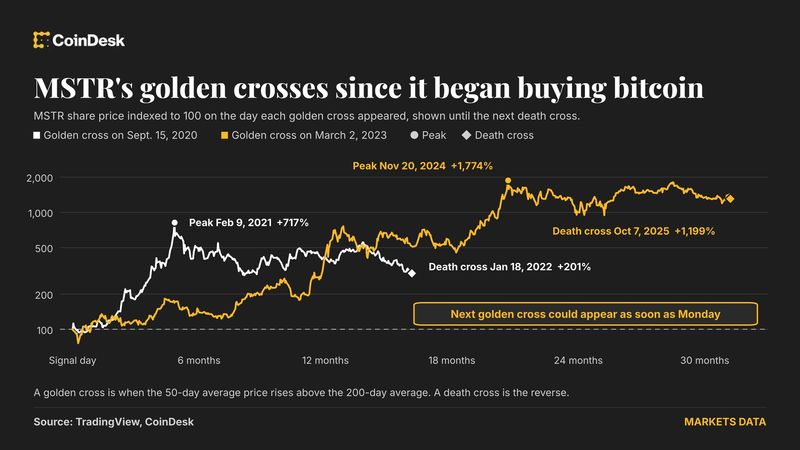
Strategy on verge of golden cross, just weeks after bitcoin flashed same bullish signal
Your day-ahead look for Oct. 19, 2026

Stablecoin Growth Cooled as Deposit Rates Rose, With USDC Most Exposed, Working Paper Says
When U.S. banks paid savers more, stablecoins grew more slowly, according to a Bank for International Settlements working paper pu...

USDC Network Fees in 2026: Ethereum vs Solana vs Other Chains, Priced to the Cent
A USDC balance is the same dollar on every chain Circle issues it on. Moving it is not the same price. In October 2026 the spread...

Zerohash rolls out a new tool to move crypto without copying wallet addresses
The launch comes as Zerohash bids for a federal trust charter.