Buying Bitcoin Now Is Like Getting It Below $10,000 In 2019: Experts
Bitcoin is weaving through a consolidation phase since marking a new all-time high of $73,777 in mid-March. Since then, Bitcoin’s daily closing prices have exhibited significant restraint, never sealing above $71,500 and...
Archive context
Older archive item. Useful for background and entity history, but not a fresh market-moving signal.

Bitcoin is weaving through a consolidation phase since marking a new all-time high of $73,777 in mid-March. Since then, Bitcoin’s daily closing prices have exhibited significant restraint, never sealing above $71,500 and maintaining a floor above $54,000, though it has seen a major intraday low touching $49,000. This consolidation phase has nudged the Fear and Greed Index towards a cautious “fear” score of 30, revealing an atmosphere of apprehension amongst traders who find themselves frequently whipsawed by the volatile market dynamics.
Is $60,000 The New $10,000 For Bitcoin Price?Despite the prevailing market nerves, some market experts believe that this is a potential buying opportunity, reminiscent of similar market conditions seen in 2019. Bloomberg ETF expert James Seyffart remarked via X: “Bitcoin right now around $50k-$70k over the last 6 months kinda sorta reminds of BTC trading around $7k – $10k from mid 2019 through early to mid 2020.”
He acknowledges the complexities of comparing historical and current charts, emphasizing that while historical patterns should not dictate future outcomes, the comparative dynamics offer insightful parallels. “I obviously know not to equate historical charts with current charts. i know all the differences of the current price dynamics etc. $10k was way further off the $20k+ ATH that 60K is. But go ahead — make fun of me. I can take it,” Seyffart added.
James “Checkmate” Check, a leading on-chain analyst and co-founder of Checkonchain, concurred with Seyffart’s observation. “The similarities between the 2024 chop-consolidation, and the one we experienced back in 2019 are strange, and uncanny.”
In 2019, the market notably surged from $4,000 to $14,000 within three months, significantly driven by the PlusToken Ponzi scheme in China, which absorbed approximately 2% of Bitcoin’s total circulating supply at the time. This was followed by a mass sell-off of these acquired coins on Huobi by the Chinese CCP, contributing to prolonged market choppiness until the sharp downturn in March 2020.
Drawing a parallel, Check noted that a similar sequence unfolded in 2024 when the market climbed from $40,000 to $73,777, catalyzed by a substantial uptake in spot bids from US spot ETFs, absorbing around 5% of the Bitcoin supply. This was succeeded by substantial selling activities from the US and German governments, involving approximately 70,000 BTC, which contributed to sustained market chop until the 5-August Yen Carry Trade unwind.
“Seriously, it is truly bizarre how similar these events are, and this is just based on the headline events. There is even more evidence below the surface,” Check concluded. He shared several on-chain metrics which highlight the strong similarities.
His “Supply Overheads During 2024 Chop-consolidation” chart showed that the 6-month sum of spent coins older than 1 year was quite similar to historical movements. In 2019, 1.75 million BTC was moved by this cohort; comparably, in 2024, as of today, 1.9 million BTC has been mobilized. Noteworthy, the large entities, including the Grayscale Bitcoin Trust (GBTC), German Government, and the US government, accounted for about 454,000 BTC of this movement.
Additional data from Check’s analysis highlighted the “Realized Profits” during these periods. In 2019, 3.4 million BTC were sold for profit over six months. In 2024, this figure stands at 3.33 million BTC.
However, the analysis of realized losses provides a stark contrast between the two periods. In 2019, losses equaled 30% of the profits, indicating a market fraught with investor fear and readiness to sell at losses. Conversely, in 2024, losses are only 10% of the profits. This comparison demonstrates how market sentiment has shifted from 2019 to 2024, with investors in 2024 appearing more confident and less prone to panic selling.
At press time, BTC traded at $59,689.
Why this matters
This bitcoin story adds another data point to the current market tape and is useful when read alongside nearby source coverage.
Original source
Read on NewsBTCRelated market context

Ethereum sees biggest exchange withdrawal in four months as October ETF losses top $1 billion
About 169,770 ETH left centralized exchanges on net in one day, Santiment reported Oct. 23, the largest daily withdrawal in more t...

Binance Founder CZ Makes Shocking Claim About AI Hacking: “No Crypto Wallet Is 100% Safe”
The comments followed two X posts in which CZ discussed the limits of digital security and AI risks, highlighting phishing and soc...
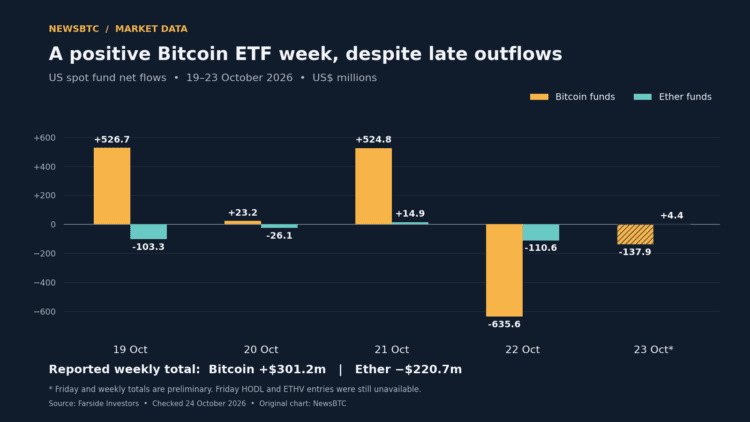
Bitcoin ETF Week Stays Positive After Nearly $774 Million In Late Outflows
TL;DR: Farside’s preliminary figures show US Bitcoin funds retaining a $301.2 million weekly inflow despite two days of withdrawal...
FCA Proposes Crypto Crime Guidance On Wallet Checks And Blockchain Analytics
TL;DR: The FCA is consulting on updated financial crime guidance for crypto businesses, including customer checks, blockchain anal...
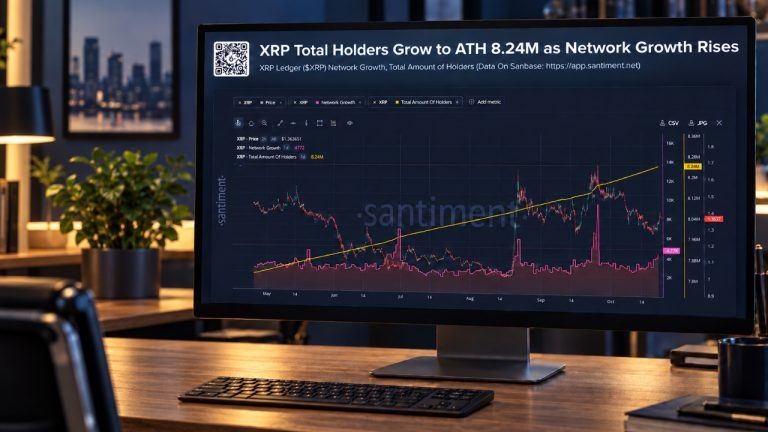
XRP Wallets Hit Record 8.24 Million as Network Growth Accelerates
XRP Ledger’s wallet count has reached 8.24 million, extending its climb through months of price volatility. Santiment paired the m...
US spot XRP ETFs see $4.25 million in weekly inflows after brief outflow
XRP ETF inflows suggest institutional interest persists despite broader crypto ETF outflows, highlighting potential strategic posi...