Half Way Through The 4 Year Bitcoin Cycle
Bitcoin has historically followed a familiar four-year cycle. Now, two years into the current cycle, investors are closely watching patterns and market indicators for insights into what the next two years may hold. This...
Archive context
Older archive item. Useful for background and entity history, but not a fresh market-moving signal.

Bitcoin has historically followed a familiar four-year cycle. Now, two years into the current cycle, investors are closely watching patterns and market indicators for insights into what the next two years may hold. This article dives into the anatomy of Bitcoin’s four-year cycle, past market behavior, and future possibilities.
The 4 Year CycleBitcoin’s four-year cycle is partly influenced by the scheduled halving events, which reduce the block reward miners receive by 50% every four years. This halving decreases the supply of new Bitcoin entering the market, often creating supply-demand pressures that can push prices higher.
This can be clearly visualized by the Stock-to-Flow Model, which compares the existing BTC in circulation to its inflationary rate, and models a ‘fair-value’ based on comparable hard assets such as Gold and Silver.
Figure 1: Bitcoin halving impact visualized through the Stock-to-Flow Model.Currently, we’re midway through this cycle, meaning we are potentially entering a period of exponential gains as the typical one year catch-up phase following the halving progresses.
A Look Back at 2022Two years ago, Bitcoin faced a severe crash amid a series of corporate implosions. November 2022 marked the downfall of FTX, as rumors of insolvency triggered massive sell-offs. The domino effect was brutal, as other crypto institutions, such as BlockFi, 3AC, Celsius, and Voyager Digital, also went under.
Figure 2: Cryptocurrencies such as FTT, linked to FTX, collapsed nearly 100% in a few days.Bitcoin’s price tumbled from around $20,000 to $15,000, mirroring the broader market panic and leaving investors worried about Bitcoin’s survival. However, true to form, Bitcoin rallied again, climbing back up fivefold from the 2022 lows. Investors who weathered the storm were rewarded, and this rebound supports the argument that Bitcoin’s cyclical nature remains intact.
Similar SentimentIn addition to price patterns, investor sentiment also follows a predictable rhythm across each cycle. Analyzing the Net Unrealized Profit and Loss (NUPL), a metric showing unrealized gains and losses in the market, suggests that emotions like euphoria, fear, and capitulation repeat regularly. Bitcoin investors typically face intense feelings of fear or pessimism during each bear market, only to shift back toward optimism and euphoria as prices recover and rise. Currently, we’re once again entering the ‘Belief’ stage following our early cycle runup and subsequent consolidation.
Figure 3: NUPL indicating similar sentiment at the same stage in every cycle. The Global Liquidity CycleThe global money supply and cyclical liquidity, as measured by Global M2 YoY vs BTC, has also followed a four-year cycle. For instance, M2 liquidity bottomed out in 2015 and 2018, just as Bitcoin hit lows. In 2022, M2 again hit a low point, perfectly aligning with Bitcoin’s bear market bottom. Following these periods of economic contraction, we see fiscal expansion across central banks and governments everywhere, which leads to more favorable conditions for Bitcoin price appreciation.
Figure 4: Global liquidity cycles aligning with BTC bull/bear markets. Familiar PatternsHistorical price analysis suggests that Bitcoin’s current trajectory is strikingly similar to previous cycles. From its lows, Bitcoin usually takes around 24-26 months to break past previous highs. In the last cycle, it took 26 months; in this cycle, Bitcoin’s price is on a similar upward trajectory after 24 months. Bitcoin has historically peaked about 35 months after its lows. If this pattern holds, we may see significant price increases through October 2025, after which another bear market could set in.
Following the anticipated peak, history suggests Bitcoin would enter a bear phase in 2026, lasting roughly one year until the next cycle begins anew. These patterns aren’t a guarantee but provide a roadmap that Bitcoin has adhered to in previous cycles. They offer a potential framework for investors to anticipate and adapt to the market.
Figure 5: Similar timeframes for new highs, cycle peaks, and lows over the previous cycles. ConclusionDespite challenges, Bitcoin’s four-year cycle has endured, largely due to its supply schedule, global liquidity, and investor psychology. As such, the four-year cycle remains a valuable tool for investors to interpret potential price movements in Bitcoin and our base case for the rest of this cycle. However, relying solely on this cycle could be shortsighted. By incorporating on-chain metrics, liquidity analysis, and real-time investor sentiment, data-driven approaches can help investors respond effectively to changing conditions.
For a more in-depth look into this topic, check out a recent YouTube video here: The 4 Year Bitcoin Cycle - Half Way Done?
Why this matters
This bitcoin story adds another data point to the current market tape and is useful when read alongside nearby source coverage.
Original source
Read on Bitcoin MagazineRelated market context

Europol says crypto’s quantum upgrade could take years and urges work to start now
Europol, the EU’s law enforcement agency, is urging the cryptocurrency industry to begin preparing wallet and protocol upgrades fo...
From Zero to $8 Million: Satoshi-Era Bitcoin Awakens After 16 Years
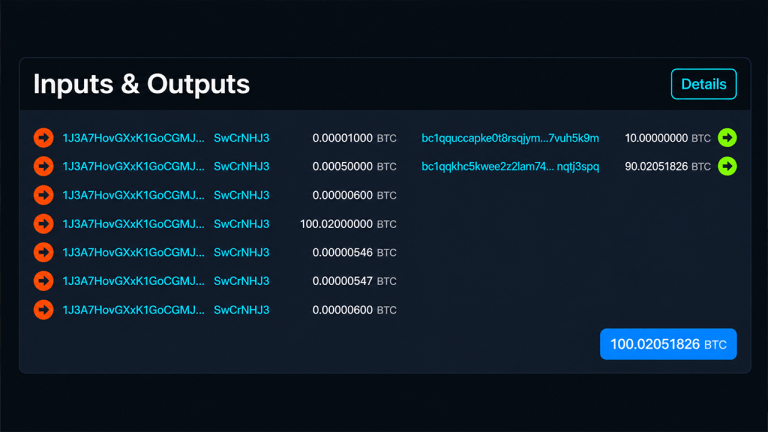
On Oct. 7, Galaxy Research disclosed that it had identified a batch of 100 bitcoin mined in July 2010 that had finally stirred aft...

100 Bitcoin mined in 2010 move for the first time in 16 years
The movement of long-dormant Bitcoin highlights potential shifts in market dynamics and investor strategies, impacting future cryp...
Bitcoin mined for pennies in 2010 moves after 16 years, now worth $8.5 million
The 100 BTC came directly from two mining rewards created during Bitcoin’s “Satoshi era” and had not moved for more than 16 years.

AI may be keeping Bitcoin’s biggest macro headwind alive after the Fed stops hiking
Bitcoin faces a new macro headwind from the artificial-intelligence boom as massive infrastructure spending competes for long-term...

Bitcoin ETFs Bleed $484.9 Million As BlackRock Leads A Broad Day Of Outflows
TL;DR: US spot Bitcoin ETFs recorded $484.9 million in net outflows on October 7, according to Farside Investors. BlackRock’s IBIT...