Latest Bitcoin Top Is Different From 2021 Peak, Analyst Explains Why
An analyst has explained why the recent high in Bitcoin has experienced different market conditions than those observed during the 2021 bull run peak. Bitcoin Liquidations Have Been Short-Dominated In Recent Market High...
Archive context
Older archive item. Useful for background and entity history, but not a fresh market-moving signal.

An analyst has explained why the recent high in Bitcoin has experienced different market conditions than those observed during the 2021 bull run peak.
Bitcoin Liquidations Have Been Short-Dominated In Recent Market HighIn a new post on X, on-chain analyst Checkmate pointed out how the latest 2024 high achieved following the spot exchange-traded fund (ETF) inflows has a major difference when compared to the 2021 peak.
The difference lies in the trend registered on derivatives markets. Below is the chart shared by the analyst that shows the trend in the dominance of long liquidations in the sector over the last few years.
“Liquidation” here naturally refers to the act of forceful closure that any derivatives market contract undergoes on an exchange when it accumulates losses of a certain degree.
The risk of a contract getting liquidated becomes higher, and the more volatile the asset price gets. During sharp rallies and crashes, huge amounts of liquidation can pile up in the market.
From the chart, it’s visible that as the rally in the cryptocurrency had occurred this year, the short holders had been taking a beating. This was only natural as surges pile up losses for these investors betting on a decline, so price growth as rapid as the one witnessed would have pushed many of these contracts toward liquidation.
Interestingly, the scale of the short dominance maintained throughout the run, implying that the investors didn’t quite believe the run would continue any further at every point of the rally, so they bet against it.
This has also remained true in the recent stagnation following the top, as short liquidations have outweighed the long ones even though the price has decreased.
As is apparent in the graph, the 2021 peaks saw a different trend. Longs were getting liquidated as Bitcoin topped out during both the first half of the 2021 peak and the second half.
In those periods, the investors had become too greedy and were only betting on the rise to continue even when the asset had slowed down. This greed appears to haven’t overtaken the market in the bull run.
While the current Bitcoin rally differs from the last one in this metric, analyst Maartunn has pointed out in an X post another indicator where the trend appears to be similar to that observed in previous peaks.
This indicator is the Coin Days Destroyed (CDD), which basically tells us about the scale of dormant coin movement that’s happening in the market right now. It would appear that this metric had attained very high levels recently.
“Coin Days Destroyed has probably peaked,” says Maartunn. “Bitcoin’s price typically reaches its peak around the same time.” It should be noted that although this has been true for some of the tops, the 2021 peak took months to form after the metric peaked.
BTC PriceAt the time of writing, Bitcoin is floating around $62,200, up more than 5% over the past week.
Why this matters
This bitcoin story adds another data point to the current market tape and is useful when read alongside nearby source coverage.
Original source
Read on NewsBTCRelated market context

Crypto News Today: BTC, ETH, XRP Slide After Fed Decision Keeps Rates Unchanged
The Federal Open Market Committee (FOMC) kept interest rates unchanged on October 28, but its assessment of inflation and economic...

Microsoft Copilot AI Predicts a Historic BTC Move Post-FOMC
Microsoft Copilot AI predicts a wildly unimaginable move for Bitcoin (BTC USD) could be in play starting this week, after the Fede...
Bitwise Raises Bitcoin Target to $1.6 Million as Institutions Keep Buying
Bitcoin Magazine Bitwise Raises Bitcoin Target to $1.6 Million as Institutions Keep Buying Bitwise Asset Management this week rele...

Zcash (ZEC) Price Prediction: Whale Goes Long Before FOMC Announcement as H&S Pattern Puts $1,350 in Focus
Traders are watching whether Zcash price can break above $1,350, potentially confirming a bullish chart pattern and opening the wa...
Solana Breakpoint London Adds Revolut Chair and Former UK Leaders
TL;DR: Solana has expanded the speaker lineup for its November Breakpoint event in London with political and financial-services fi...
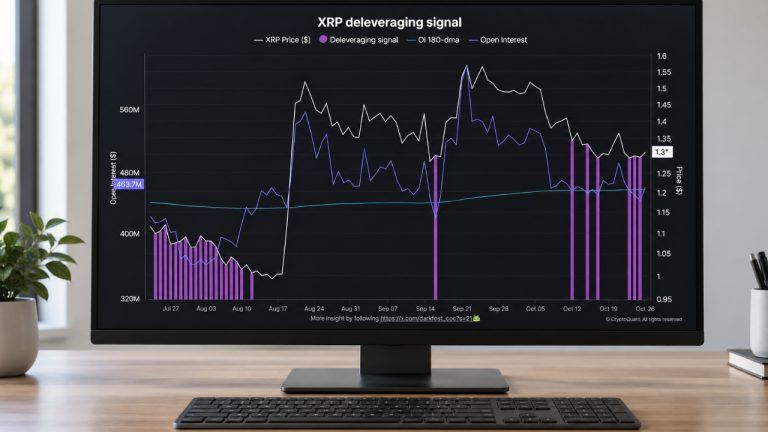
XRP Flashes Signal Seen Before 72% Rally as Binance Leverage Falls
XRP has flashed a deleveraging signal that previously preceded a 72% rally, according to an analysis shared by Cryptoquant. Fallin...