AAVE Price Prediction: Surges 20% This Week, Rally Could Extend Above $85
AAVE price started a major increase from the $65 support zone. It is up nearly 20% this week and might extend gains above the $85 resistance. AAVE price gained pace after it surpassed the $75 resistance against the US do...
Archive context
Older archive item. Useful for background and entity history, but not a fresh market-moving signal.

AAVE price started a major increase from the $65 support zone. It is up nearly 20% this week and might extend gains above the $85 resistance.
- AAVE price gained pace after it surpassed the $75 resistance against the US dollar.
- The price is trading below $85 and the 100-day simple moving average.
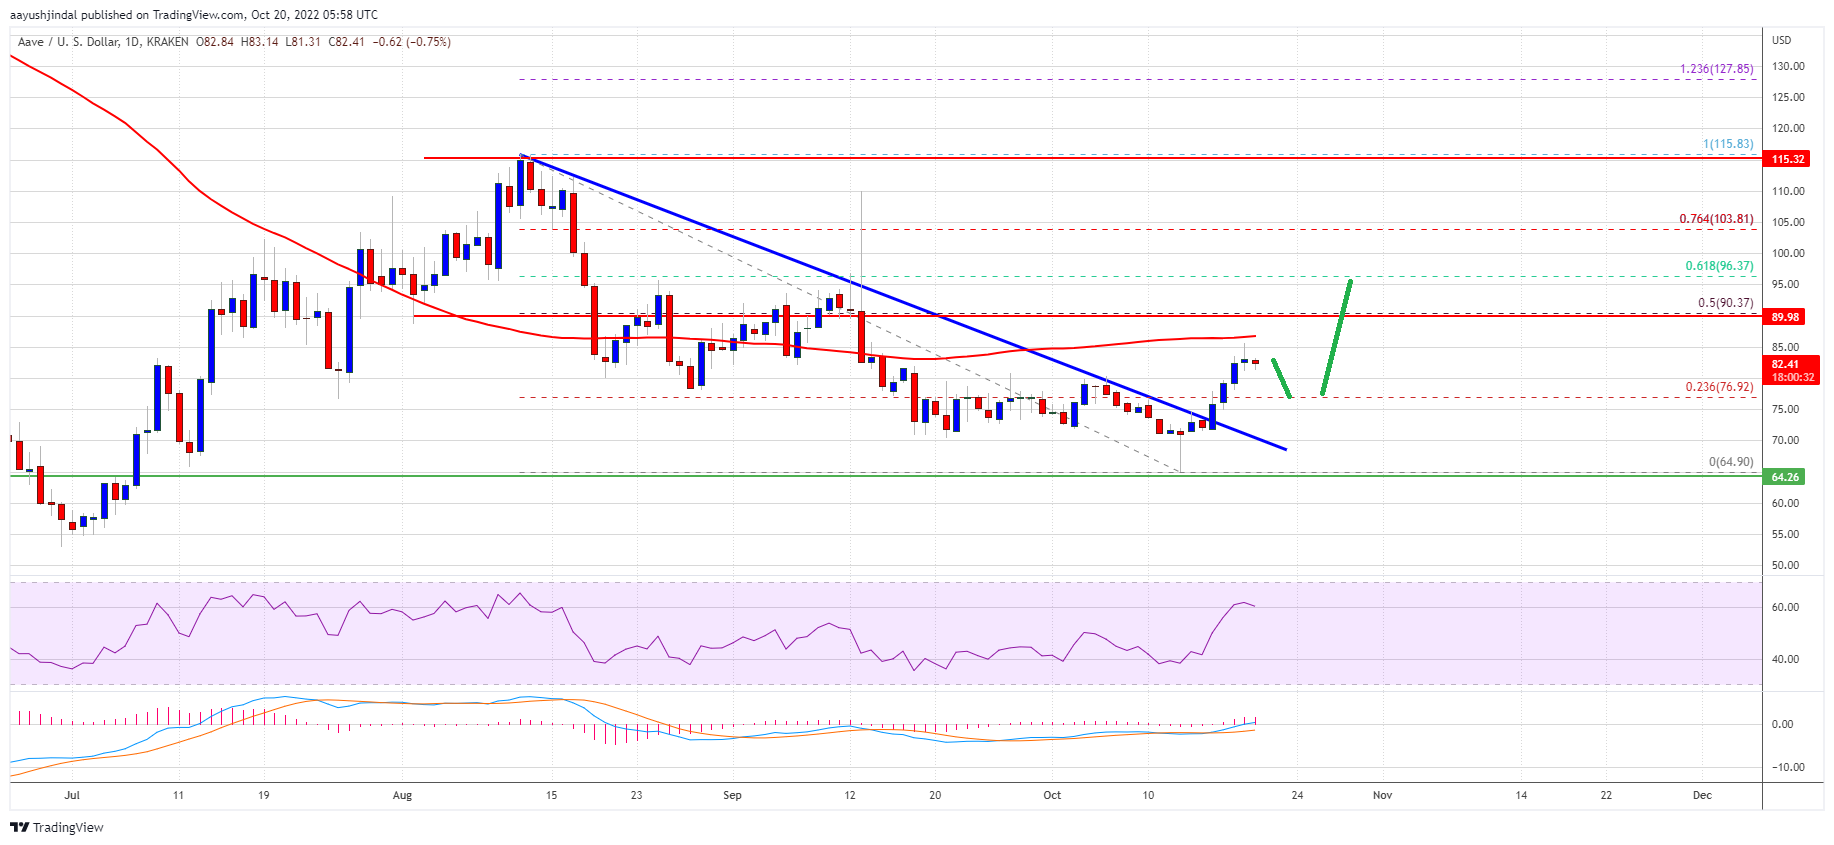
- There was a break above a major bearish trend line with resistance at $75 on the daily chart of the AAVE/USD pair (data source from Kraken).
- The pair could continue to rise and might soon test the $100 resistance zone.
After a steady decline, AAVE price found support near the $65 zone. The price formed a base above the $65 level and started a steady increase.
There was a clear move above the $72 and $75 resistance levels. The price climbed above the 23.6% Fib retracement level of the downward move from the $116 swing high to $65 low. Besides, there was a break above a major bearish trend line with resistance at $75 on the daily chart of the AAVE/USD pair.
The price is now trading near the $85 resistance and the 100-day simple moving average. It is also showing positive signs, outperforming bitcoin and ethereum.
Source: AAVEUSD on TradingView.com
On the upside, an immediate resistance is near the $85 zone. The next major resistance is forming near the $90 zone. It is close to the 50% Fib retracement level of the downward move from the $116 swing high to $65 low. If there is an upside break above the $95 and $100 levels, the price could surge over 10%. In the stated case, the price could rise steadily towards the $100 level.
Dips Limited in AAVE?If AAVE price fails to continue higher above the $85 or $90 levels, it could start a downside correction. An immediate support on the downside is near the $80 level.
The main support is near the $75 zone. A downside break below the $75 level could open the doors for a fresh decline towards $70. The next major support is near the $65 level.
Technical Indicators
Daily MACD – The MACD for AAVE/USD is slowly losing momentum in the bullish zone.
Daily RSI (Relative Strength Index) – The RSI for AAVE/USD is now above the 50 level.
Major Support Levels – $80 and $75.
Major Resistance Levels – $85, $90 and $100.
Why this matters
This cryptocurrency story adds another data point to the current market tape and is useful when read alongside nearby source coverage.
Original source
Read on NewsBTCRelated market context

US Inflation Data Shakes Crypto Market as Bitcoin Breaks Below $73K Support
The decline intensified selling pressure across the cryptocurrency market, with Ethereum, XRP, and Solana also posting substantial...

Perplexity AI Predicts a Parabolic Rally for NEAR Crypto: Is a Triple-Digit Move Possible After CPI?
Something potentially significant could happen for NEAR Protocol by early 2027. Perplexity AI predicts a highly speculative, unlik...

Bitcoin Drops Below $74,000 as Core Inflation Runs Above Forecasts
Bitcoin (BTC) fell about 1.2% within minutes of the October inflation report on Tuesday, touching $73,400 on Coinbase before stead...

AVAX NYSE Deal Sparks 10% Rally: Avalanche Wins Tokenized Stock Role
Avalanche (AVAX) climbed on Tuesday after the New York Stock Exchange (NYSE) selected its blockchain technology to power settlemen...

Mark Zuckerberg Meta AI BTC Price Prediction for 2030
As of mid-November 2026, Bitcoin trades near $74,000–$75,000 after a period of consolidation. However, a Meta AI BTC price predict...

Bitcoin Price Trades Down Near $73,500 After Hot CPI Print Lifts Fed Hike Bets
Bitcoin Magazine Bitcoin Price Trades Down Near $73,500 After Hot CPI Print Lifts Fed Hike Bets Bitcoin price traded near $73,500...