DOT Price (Polkadot) Pumps 15% As Bulls Aim For Surge To $10
Polkadot (DOT) is gaining pace above the $7.50 resistance against the US Dollar. The price is up nearly 15% and might rise further toward $10.00. DOT is showing heavy bullish signs from the $6.65 support against the US D...
Archive context
Older archive item. Useful for background and entity history, but not a fresh market-moving signal.

Polkadot (DOT) is gaining pace above the $7.50 resistance against the US Dollar. The price is up nearly 15% and might rise further toward $10.00.
- DOT is showing heavy bullish signs from the $6.65 support against the US Dollar.
- The price is trading above the $8.00 zone and the 100 simple moving average (4 hours).
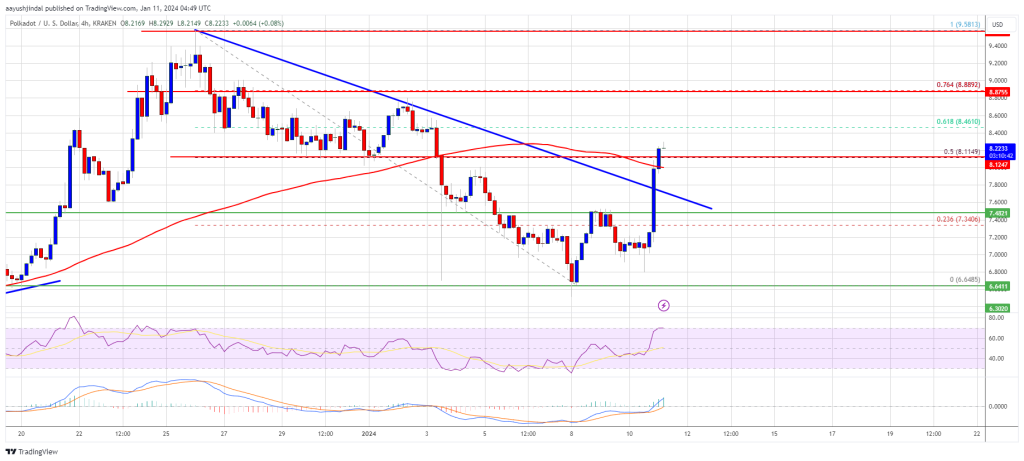
- There was a break above a key bearish trend line with resistance near $7.80 on the 4-hour chart of the DOT/USD pair (data source from Kraken).
- The pair could continue to rally unless the bears are able to defend the $8.88 resistance zone.
After a steady decline, DOT price found support near the $6.65 zone. A low was formed at $6.64 and Polkadot recently started a fresh increase. The price was able to clear the $6.85 and $7.00 resistance levels to move into a positive zone, like Bitcoin and Ethereum.
There was a break above a key bearish trend line with resistance near $7.80 on the 4-hour chart of the DOT/USD pair. The pair even surpassed the 50% Fib retracement level of the downward move from the $9.58 swing high to the $6.64 low.
DOT is now trading above the $8.00 zone and the 100 simple moving average (4 hours). Immediate resistance is near the $8.45 level. The next major resistance is near $8.88 or the 76.4% Fib retracement level of the downward move from the $9.58 swing high to the $6.64 low.
Source: DOTUSD on TradingView.com
A successful break above $8.88 could start another strong rally. In the stated case, the price could easily rally toward $9.50 in the near term. The next major resistance is seen near the $10.00 zone.
Are Dips Supported in DOT?If DOT price fails to start a fresh increase above $8.45, it could start a fresh decline. The first key support is near the $7.80 level and the same trend line.
The next major support is near the $7.50 level, below which the price might decline to $7.00. Any more losses may perhaps open the doors for a move toward the $6.65 support zone.
Technical Indicators
4-Hours MACD – The MACD for DOT/USD is now gaining momentum in the bullish zone.
4-Hours RSI (Relative Strength Index) – The RSI for DOT/USD is now above the 50 level.
Major Support Levels – $7.80, $7.500 and $7.00.
Major Resistance Levels – $8.45, $8.88, and $9.50.
Why this matters
This cryptocurrency story adds another data point to the current market tape and is useful when read alongside nearby source coverage.
Original source
Read on NewsBTCRelated market context

Anthropic Claude AI Predicts an Unbelievable XRP Q4 Move
Anthropic’s Claude AI predicts a frankly insane XRP price target by January 1, 2027. Somewhere in its notes, there’s a number. It’...

KuCoin Exits Russia and Belarus, Cutting Off Crypto Services in Major Compliance Move
Key Takeaways: KuCoin has closed down trading activity in Russia and Belarus. Affected customers are able to close post positions...

Copilot AI Predicts PI Network Binance Price
Something potentially explosive could be building for Pi Network (PI) by January 1, 2027. Microsoft Copilot AI predicts that a spe...

Binance Hack: CZ Fires Back at Elon Musk, Cites $1B SpaceX Stake as Coinbase Offers Security Support
The dispute unfolded as Binance worked to contain the October 29 attack, freeze affected assets, and reassure customers that their...

Grok AI Predicts Wild Bitcoin Price Amid $6.3Bn Binance Hack
Even as the largest exchange hack in history continues, Elon Musk’s Grok AI predicts something potentially historic could happen t...

Binance Hack: Are Funds Safu? What We Know So Far About the Biggest Heist in Crypto History
Cryptocurrency giant Binance faces what could be the largest exchange hack in history after a security breach affected an estimate...