DOT Price (Polkadot) Reaches Key Juncture, Is This Bulls Trap or Correction?
Polkadot (DOT) is correcting gains from the $7.5 resistance against the US Dollar. The price could start another increase if it stays above the $6.75 support. DOT gained pace and tested the $7.5 resistance level against...
Archive context
Older archive item. Useful for background and entity history, but not a fresh market-moving signal.

Polkadot (DOT) is correcting gains from the $7.5 resistance against the US Dollar. The price could start another increase if it stays above the $6.75 support.
- DOT gained pace and tested the $7.5 resistance level against the US Dollar.
- The price is trading above the $7.00 zone and the 100 simple moving average (4 hours).
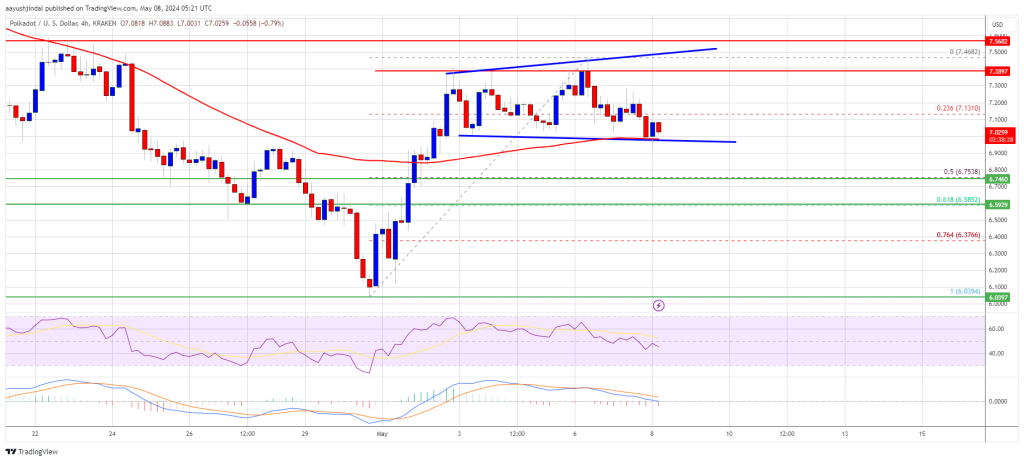
- There is a short-term expanding triangle forming with resistance at $7.50 on the 4-hour chart of the DOT/USD pair (data source from Kraken).
- The pair could continue to decline if it fails to stay above the $6.75 support.
After forming a base above the $6.00 level, DOT price started a decent increase. It broke many hurdles near $6.75 and even spiked above $7.25. A high was formed at $7.46 and the price is now correcting gains, like Ethereum and Bitcoin.
There was a move below the $7.25 support zone. The price declined below the 23.6% Fib retracement level of the upward move from the $6.03 swing low to the $7.46 high.
DOT is now trading above the $7.00 zone and the 100 simple moving average (4 hours). Immediate resistance is near the $7.25 level. The next major resistance is near $7.50. There is also a short-term expanding triangle forming with resistance at $7.50 on the 4-hour chart of the DOT/USD pair.
Source: DOTUSD on TradingView.com
A successful break above $7.50 could start another strong rally. In the stated case, the price could easily rally toward $8.00 in the near term. The next major resistance is seen near the $8.80 zone.
More Downsides in DOT?If DOT price fails to start a fresh increase above $7.25, it could continue to move down. The first key support is near the $7.00 level and the 100 simple moving average (4 hours).
The next major support is near the $6.75 level or the 50% Fib retracement level of the upward move from the $6.03 swing low to the $7.46 high, below which the price might decline to $6.50. Any more losses may perhaps open the doors for a move toward the $6.10 support zone or $6.00.
Technical Indicators
4-Hours MACD – The MACD for DOT/USD is now losing momentum in the bearish zone.
4-Hours RSI (Relative Strength Index) – The RSI for DOT/USD is now below the 50 level.
Major Support Levels – $7.00, $6.75 and $6.50.
Major Resistance Levels – $7.25, $7.50, and $8.00.
Why this matters
This cryptocurrency story adds another data point to the current market tape and is useful when read alongside nearby source coverage.
Original source
Read on NewsBTCRelated market context

Microsoft Copilot AI Predicts a Historic BTC Move Post-FOMC
Microsoft Copilot AI predicts a wildly unimaginable move for Bitcoin (BTC USD) could be in play starting this week, after the Fede...

Perplexity AI Predicts Somnia Crypto Is About to Explode
Perplexity AI predicts a significant development for Somnia crypto by January 1, 2027. Since September, SOMI has surged over 100%,...

Bitcoin Price Trades Above $81,500 as Fed Keeps Rates Steady in Split Vote
Bitcoin Magazine Bitcoin Price Trades Above $81,500 as Fed Keeps Rates Steady in Split Vote The Federal Reserve left its benchmark...

Crypto News Today: BTC, ETH, XRP Slide After Fed Decision Keeps Rates Unchanged
The Federal Open Market Committee (FOMC) kept interest rates unchanged on October 28, but its assessment of inflation and economic...

Mark Zuckerberg’s Meta AI Predicts an Astonishing XRP Price
Mark Zuckerberg’s Meta AI predicts that something potentially historic could be building for Ripple (XRP USD) by January 1, 2027....

Nearly 9 in 10 Major Firms Have Already Turned to Tokenized Money: DBS Survey
Corporate treasuries are moving onto blockchain rails faster than many expected, with 88% of major businesses already using or tes...