MATIC Rises Again, Will It Target The Psychological Level Of $1?
MATIC has been on a bullish streak over the past week now. Despite the bullish streak, it hasn’t been able to move past the $1 psychological level. Technical indicators have remained bullish on the chart and pointed towa...
Archive context
Older archive item. Useful for background and entity history, but not a fresh market-moving signal.

MATIC has been on a bullish streak over the past week now. Despite the bullish streak, it hasn’t been able to move past the $1 psychological level. Technical indicators have remained bullish on the chart and pointed towards chances of reaching the $1 price ceiling.
Over the last week, MATIC surged 22% and on the daily chart the coin moved up by 7%. MATIC had managed to touch the $0.97 mark however a small fall in buying strength caused the altcoin to fall on the chart briefly. Buying strength was positive displaying that bullish strength hadn’t faded away.
A pullback can bring MATIC down to the $0.77 level. If buying strength remains consistent, then the coin can attempt to break above the psychological price ceiling of $1. At press time, MATIC had secured itself above the $0.75 support line.
The global cryptocurrency market cap today was at $1.09 Trillion, a 2.6% positive change in the last 24 hours.
MATIC Price Analysis: Four Hour Chart MATIC was priced at $0.87 on the four hour chart | Source: MATICUSD on TradingViewThe altcoin was trading at $0.87 at the time of writing. The coin had briefly touched the $0.97 mark but was met with selling pressure. Overhead resistance for the coin stood at $0.92, a move above which could force MATIC to touch the $1.
Local support for the coin stood at $0.77, fall from that level will cause MATIC to reach $0.60. The amount of MATIC traded over the last trading session fell slightly which indicated that buying strength fell on the chart.
MATIC displayed positive buying strength on the four hour chart | Source: MATICUSD on TradingViewThe altcoin had visited the overbought zone a couple of times, however as the coin fell in value buying strength dipped. At the time of writing, buying strength remained more than selling strength.
The Relative Strength Index was pictured above the half-line which meant that buyers were more in number.
Price of the altcoin was above the 20-SMA line which meant that the buyers drove the price momentum in the market. This was a sign of bullishness for the altcoin.
Related Reading | Bitcoin Funding Rate Remains Positive, More Decline Soon?
MATIC displayed sell signal on the four hour chart | Source: MATICUSD on TradingViewThe altcoin registered a small dip in buying strength and the technical indicator displayed the same. The Moving Average Convergence Divergence depicts the price momentum and change in that. MACD underwent a bearish crossover and formed red signal bars.
These red signal bars represent sell signal for the altcoin. Awesome Oscillator portrays the price trend and also points towards chances of a reversal, the green signal bars still represent bullish strength.
If the coin continues to keep up with the pace then buying strength has to support the coin. Broader market strength shall also help MATIC to achieve its psychological target of $1.
Suggested Reading | Polygon (MATIC) Looks Set For A Retracement After Recent Gains
Featured image from The Face, chart from TradingView.comWhy this matters
This cryptocurrency story adds another data point to the current market tape and is useful when read alongside nearby source coverage.
Original source
Read on NewsBTCRelated market context

Bitcoin Price Today: Negative Funding Rates Signal Growing Bearish Bets as BTC Nears $68K
The latest data presents a mixed picture, however, as Hyperliquid whales have returned to net-long positions despite deteriorating...

U.S. Wholesale Inflation Hits 6.5%—What It Means for Bitcoin’s Next Move
Bitcoin’s inflation problem has a fresh complication. U.S. wholesale prices rose 6.5% over the year to October, their fastest annu...

XRP Price Today: $0.98 Support Under Threat Despite Oversold RSI
Deeply oversold indicators suggest a possible relief bounce, but the broader technical structure remains bearish. The XRP price ha...

XRP Price at the $1 Line: Should You Sell or Add More to Your Bag?
XRP is dangerously close to losing the $1 price mark, putting holders in an uncomfortable position. Some holders may see another b...

Bill Miller IV: “They’re Not Printing More Bitcoin”
▶Bitcoin Magazine Bill Miller IV: “They’re Not Printing More Bitcoin” Bill Miller IV, Chairman and CIO of Miller Value Partners, j...
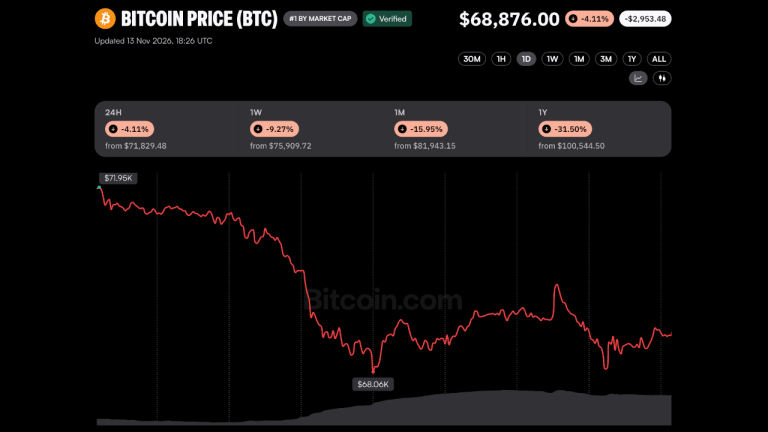
Bitcoin Could Rebound to $90K but Risks $65K Retest: 21shares Strategist
Bitcoin could recover toward $87,000 and eventually exceed $90,000, according to 21shares strategist Matt Mena. He linked the outl...