Shiba Inu Could Be Bearish, But This Pattern Suggests Otherwise
Shiba Inu had picked up momentum just a week back when it soared by 35% following the news of the Robinhood listing. The broader market currently exhibits weakness as Bitcoin continues to struggle beneath the $40,000 mar...
Archive context
Older archive item. Useful for background and entity history, but not a fresh market-moving signal.

Shiba Inu had picked up momentum just a week back when it soared by 35% following the news of the Robinhood listing.
The broader market currently exhibits weakness as Bitcoin continues to struggle beneath the $40,000 mark. Ethereum also was priced at $2900 at press time. The king altcoin was rejected from the $3000 level over the past trading sessions.
The meme-coin is consolidating at the moment. SHIB has been sandwiched between $0.00003000 and $0.00002000 respectively.
Buying strength subsequently has been adversely affected owing to the consolidation. In the last 24 hours, Shiba Inu lost 3% of its value and over the past week, it depreciated by 7%. The global cryptocurrency market cap was at $1.93 Trillion with a fall of 1.4% in the past 24 hours.
Shiba Inu Price Analysis: One-Day Chart Shiba Inu displays the Adam and Eve pattern on the 24-hour chart. Image Source: SHIB/USD on TradingViewShiba Inu was priced at $0.00002369 at the time of writing. Prices had been moving sideways for a considerable period of time. Buyers have decided to steer clear of the meme-coin as the short-term reading depicts bearishness on the charts. The coin, however, flashes a bullish pattern on the one-day chart.
The above chart displayed the “Adam” and “Eve” pattern continuously for the 109th day and it continues to exhibit the same. This technical formation is considered to be bullish.
The two distinctive valleys that have formed on the charts are referred to as Adam (Triangle) and Eve (Semi-Circle). At $0.00003289, SHIB is expected to experience a break-out and then aim for $0.00004436 and that would mean a 60% hike from the current price level.
If Shiba Inu falls in value further, the nearest support line stands at $0.00002068.
Suggested Reading | Metaverse Madness: Watch These 3 Metaverse Coins – The Sandbox (SAND), Shiba Inu (SHIB), Pac-Man Frog (PAC)
Technical Analysis: Four Hour Chart Shiba Inu has witnessed a fall in buying strength on the four-hour chart. Image Source: SHIB/USD on TradingViewConsistent consolidation has left buyers in a dilemma, whether to HODL or not. As seen in the above chart, buying strength has considerably fallen over the past week. Over the next trading sessions, SHIB could breach its present price level and fall to the next price floor.
On the Relative Strength Index, SHIB was seen below the 40-mark which would soon touch the oversold territory. Upon touching the oversold mark, SHIB could fall further. Chaikin Money Flow that determines capital outflow, has suggested that inflows were lesser than outflows.
Shiba Inu is on a negative price momentum on the four-hour chart. Image Source: SHIB/USD on TradingViewSHIB’s prices were settled below the 20-SMA line since the past week and was the same at press time. This determined that sellers had control over the market and they were in charge of the price momentum. The above reading also confirmed the bearishness in the market.
Awesome Oscillator suggests the current price momentum of the coin. AO displayed red histograms underneath the half-line and that meant that SHIB was in negative price action. A resurgence of buyers could immediately help SHIB get out of the price consolidation.
Suggested Reading | Move Over Bitcoin – Is Shiba Inu The Next Crypto Gold?
Why this matters
This cryptocurrency story adds another data point to the current market tape and is useful when read alongside nearby source coverage.
Original source
Read on NewsBTCRelated market context

Bitcoin falls 12% below its 200-week average as analysts warn of a deeper slide
Bitcoin's dip below its 200-week average raises concerns about market stability, with potential for further declines impacting inv...

Analyst: Bitcoin Below $70,000 is a ‘Gift From the Market’
Bitcoin Magazine Analyst: Bitcoin Below $70,000 is a ‘Gift From the Market’ K33 Research said bitcoin is trading in “deep value te...

Dogecoin (DOGE) Price Prediction: Can $0.052-$0.06 Support Trigger a Major Reversal as Bitfinex Longs Surge?
According to Brave New Coin, Dogecoin recently traded near $0.06376 following a sharp decline, bringing the price closer to a majo...

‘Gift from the market’: Bitcoin shows signs of a local bottom after six weeks of losses, analyst says
K33 said bitcoin may have found a local bottom after six weekly losses, with options traders still seeking downside protection.
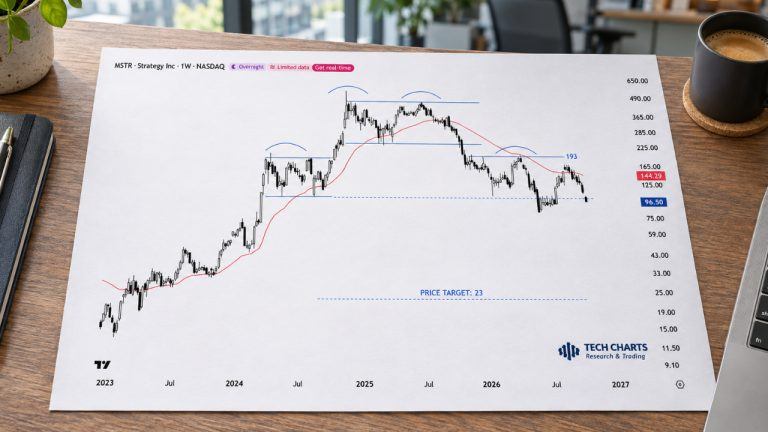
Bitcoin Giant Strategy’s Shares Could Drop 75% to $23 Amid Bearish Pattern: Analyst
Strategy shares have already lost 44% in six months, yet a new analysis sees a potential fall toward $23 for the $53 billion bitco...

EIGEN Falls 48% in Four Weeks, Lagging Bitcoin, Ether
EigenCloud's restaking collateral was valued at $4.52 billion, down about 28.5% from an Oct. 21 snapshot.... Read the full story a...