Toncoin Heading Toward 40% Breakout, Pattern Could Suggest
An analyst has pointed out how Toncoin (TON) is currently trading inside a Triangle pattern that could potentially set the stage up for a 40% move. Toncoin Has Been Stuck Inside A Triangle On The Daily Timeframe In a new...
Archive context
Older archive item. Useful for background and entity history, but not a fresh market-moving signal.

An analyst has pointed out how Toncoin (TON) is currently trading inside a Triangle pattern that could potentially set the stage up for a 40% move.
Toncoin Has Been Stuck Inside A Triangle On The Daily TimeframeIn a new post on X, analyst Ali Martinez has talked about a pattern that Toncoin has recently been moving inside. The pattern in question is a Triangle from technical analysis (TA), which forms when an asset’s price observes consolidation between two converging trendlines.
The upper line of the pattern is likely to be a source of resistance in the future, while the lower one is that of support. A breakout of either of these lines can imply a continuation of the trend in that direction.
There are a few different types of Triangles in TA. Three popular ones include the Ascending, Descending, and Symmetrical variations. The orientation of the trendlines relative to each other defines which type a particular triangular channel falls under.
In an Ascending Triangle, the upper trendline is parallel to the time-axis. This means that as the price travels inside the pattern, its consolidation shrinks toward a net upside. The Descending Triangle involves just the opposite case; the upper line is sloped downward while the lower one is flat.
The third variation, the Symmetrical Triangle, has its trendlines at a roughly equal and opposite slope. In this pattern, the price’s range tightens to a point in a sideways manner.
Now, here is the chart shared by the analyst that shows the Triangle pattern that Toncoin has seemingly been trapped within during the past few months:
From the graph, it’s visible that the Triangle that the 1-day price of Toncoin has been following looks similar to a Symmetrical Triangle, but it’s not a perfect one; there is a slight bias to the downside.
The cryptocurrency most recently found support at the lower line and has since climbed toward the midway point between the trendlines. The coin’s price is now not too far from the apex of the pattern.
Generally, breakouts become more likely as consolidation becomes tighter, so it’s possible that TON may be approaching one. According to the analyst, a breakout, if it happens, could potentially end up leading to a 40% move for Toncoin.
As for which direction a breakout might take the asset in, Symmetrical Triangles usually have both sides at equal probability. Since the Triangle in the current case is slightly angled down, however, an exit below the lower line may be a bit more likely.
It now remains to be seen how Toncoin’s price will develop in the coming days and if the pattern will play any role.
TON PriceAt the time of writing, Toncoin is trading around $3.3, up over 2% in the last seven days.
Why this matters
This cryptocurrency story adds another data point to the current market tape and is useful when read alongside nearby source coverage.
Original source
Read on NewsBTCRelated market context

XRP Price Could Surge 145% as 2023 Rally Pattern Returns
XRP price traded near $1.34 on October 16, about 4% below the 200-day simple moving average (SMA) at $1.36. The immediate test is...

Crypto Analyst Lark Davis: The Bitcoin Bull Run has Begun
Bitcoin Magazine Crypto Analyst Lark Davis: The Bitcoin Bull Run has Begun Bitcoin has been trading sideways in the $80Ks, but Lar...

Bitcoin (BTC) Price Prediction: Glassnode Signals Potential Price Floor Near $80K as Sellers Capitulate
Similar spikes in Bitcoin’s realized losses preceded local price bottoms in August and September, raising the possibility that the...

ChatGPT AI Predicts Million-Dollar Bitcoin by 2027
ChatGPT AI predicts Bitcoin will hit $1M+, which isn’t a crazy call, since many analysts share the same view. What makes this pred...
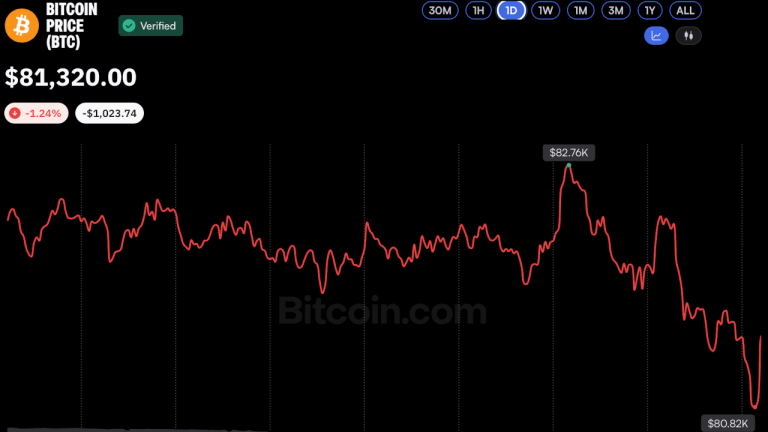
Bitcoin Price Hovers Near $81K as Analysts See Potential Market Bottom
Bitcoin slipped below $81,000 on Oct. 16 amid heightened market volatility, but analysts remained cautiously optimistic, suggestin...

Bitcoin steadies near $82,000 as Warsh declines to signal another Fed hike
Bitcoin's resilience amid market volatility highlights its potential as a hedge against economic uncertainty and shifting monetary...