Bullish Divergences On Ethereum Chart, What’s Incoming?
The Ethereum price is trading laterally on its daily chart. The coin has moved south by 1.8% in that timeframe. Both the bulls and bears are trying to take over the market as the altcoin remains within a congested price...
Archive context
Older archive item. Useful for background and entity history, but not a fresh market-moving signal.

The Ethereum price is trading laterally on its daily chart. The coin has moved south by 1.8% in that timeframe. Both the bulls and bears are trying to take over the market as the altcoin remains within a congested price zone. If the altcoin price is rejected at higher levels, the chance of a reversal might increase.
This would mean that bulls represented an upper hand. Moving sideways, however, will bring the asset close to its local support line of $1,220. The current technical outlook indicates that the bulls have not exited the market. If the bulls remain in the market, a breakout above the $1,300 price mark can be predicted.
In the event of continued consolidation, the chance of a move upward cannot be completely ruled out. The significant recovery often allows the traders to replenish their losses before the altcoin starts to trade southward.
Traders might be presented with an opportunity to enter the market at $1,220 before ETH attempts to revisit the $1,300 price. Ethereum is trading at a price nearly 74% below its all-time high secured in 2021.
Ethereum Price Analysis: One-Day ChartETH was exchanging hands at $1,251 at the time of writing. The coin has been swaying between the $1,220 and $1,300 marks. However, indicators have continued to side with the bulls as buyers have shown interest in the asset.
Overhead resistance for the Ethereum price was at $1,260. After breaking through that barrier, the coin will face a new one at $1,300. On the flip side, falling from the $1,251 level will drag the altcoin to $1,200 and then to $1,170. The amount of ETH traded in the last session declined slightly, indicating some loss in buying strength.
Technical AnalysisThe chance of Ethereum registering an uptick increases owing to the several bullish divergences on the chart. Bullish divergences are tied to the coin picking up momentum. The Relative Strength Index also spotted a bullish divergence, indicating that buying strength could get stronger.
The RSI was just above the half-line, meaning buyers were more than sellers on the chart. The Ethereum price was spotted slightly above the 20-Simple Moving Average Line. This denoted that buyers were still in charge of driving the price momentum in the market.
Other technical indicators for the altcoin continued to exhibit buying strength. The Moving Average Convergence Divergence portrays that price momentum continued to form green signal bars.
The green histograms were the buy signal for the coin, which could further mean an entry point for traders. The Chaikin Money Flow (CMF) indicates investor interest by capturing capital inflows and outflows. CMF was positive as it was above the half-line, meaning capital inflows exceeded outflows.
Why this matters
This ethereum story adds another data point to the current market tape and is useful when read alongside nearby source coverage.
Original source
Read on NewsBTCRelated market context

AI Could Weaken Ethereum Security as Cryptographic Risks Grow, Vitalik Buterin Warns
Buterin urged developers to prepare for potential AI vulnerabilities in both conventional and quantum-resistant cryptography, whil...

Bitcoin’s weekend rebound faces an $80,400 test after nearly $730 million in ETF outflows
Bitcoin traded near $82,900 in PerpFinder’s Oct. 10, 09:36 UTC snapshot, with traders watching whether the weekend rebound brings...

One year after 10/10, Bitcoin and Ether liquidity is back while altcoins lag
The crypto market's bifurcation highlights Bitcoin and Ether's institutional appeal, while altcoins face volatility and limited gr...
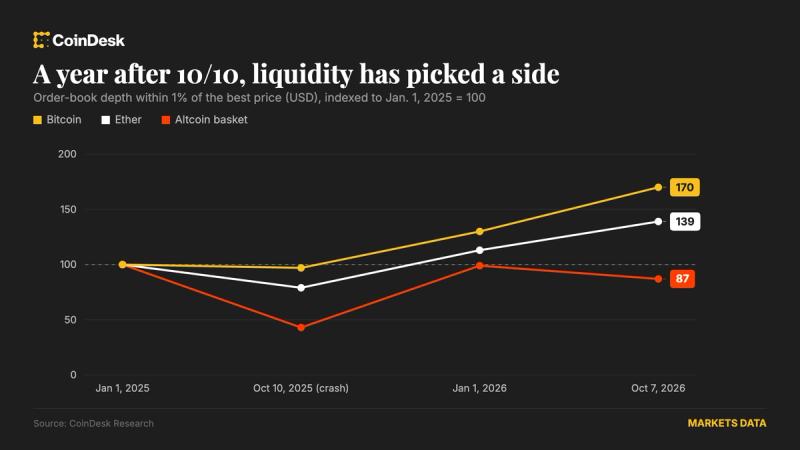
One year after 10/10, bitcoin and ether liquidity have rebuilt, but other altcoins still face risks
Bitcoin and ether order books are deeper than before the crash, while altcoin liquidity keeps eroding and spot trading remains wel...

Ethereum leads stablecoin market cap growth, adding $243M in a week
Ethereum's stablecoin growth highlights potential concentration risks and market consolidation, impacting DeFi liquidity and stabi...

Bitcoin holder loses 80 BTC worth $5.2 million after moving funds to reseller-bought Ledger
The incident underscores the critical importance of purchasing hardware wallets from official sources to ensure asset security. Th...