Ethereum Price Bounces Again But Touching These Levels Could Trigger A Sell Off
Ethereum price has rallied yet again in the last 24 hours. ETH has demonstrated an 8% jump over the past day. This has made the altcoin break past a few trading levels and now flipped them into support lines. The altcoin...
Archive context
Older archive item. Useful for background and entity history, but not a fresh market-moving signal.

Ethereum price has rallied yet again in the last 24 hours. ETH has demonstrated an 8% jump over the past day.
This has made the altcoin break past a few trading levels and now flipped them into support lines. The altcoin was quite bullish at the time of writing.
In just one week, the coin gained more than 20%, turning the price action bullish. The technical outlook of Ethereum was also leaned towards the bulls as demand for the altcoin turned heavily positive at the time of writing.
As a result, buying strength also turned optimistic at the time of writing. Ethereum can target the $1,700 resistance mark only if the bulls can maintain the price above Ethereum’s immediate resistance mark.
If the bulls lose steam, the coin could again start to trade near the $1,500 price zone. The coin could witness a sell-off at the $1,690 resistance mark.
If the bulls manage to overturn the $1,690 level, then this could be the start of a broader trend change. Buying strength and wider market strength remain vital for Ethereum.
Ethereum Price Analysis: One Day Chart Ethereum was priced at $1,620 on the one day chart | Source: ETHUSD on TradingViewETH was trading at $1,620 at the time of writing. The coin had struggled to move past the $1,500 price mark over the last few weeks.
The recent bullish force has helped Ethereum topple above a number of resistance levels.
As Ethereum continues to remain quite favorable, the jump to $1,700 could be possible if the coin breaks past the immediate price ceiling of $1,630. It can experience weighty resistance at the $1,690 level.
If the price pushes above that mark, the bulls will stay around for a considerable period of time.
A fall from the current price level will bring ETH to $1,520 and then to $1,460, causing ETH to consolidate between those levels.
The amount of ETH traded in the last session was positive, indicating a rise in buyers.
Technical Analysis Ethereum was overbought on the one day chart | Source: ETHUSD on TradingViewThe altcoin has accumulated hefty buying strength on its 24-hour chart. The Ethereum price was overvalued due to excessive demand.
The Relative Strength Index was above the 80-mark, which is a sign that buyers have heavily outnumbered sellers in the market.
Once the asset has visited the overbought zone, the price usually experiences a pull-back.
The Ethereum price was above the 20-SMA line, which indicated that demand experienced a steep increase and that buyers were driving the price momentum in the market.
Ethereum displayed buy signal on the one day chart | Source: ETHUSD on TradingViewOther technical indicators have also pictured that the bulls were in complete control of the altcoin’s price. The Awesome Oscillator formed green signal bars which were growing in size.
These were the buy signals of the coin. AO exhibits the price momentum and the strength of the price direction. The Chaikin Money Flow depicts the capital inflows and outflows at a given time.
CMF was above the half-line, which revealed that capital inflows exceeded outflows, painting a positive price action for Ethereum.
Featured Image From UnSplash, Charts From TradingViewWhy this matters
This ethereum story adds another data point to the current market tape and is useful when read alongside nearby source coverage.
Original source
Read on NewsBTCRelated market context

Ethereum leads stablecoin market cap growth, adding $243M in a week
Ethereum's stablecoin growth highlights potential concentration risks and market consolidation, impacting DeFi liquidity and stabi...

One year after 10/10, Bitcoin and Ether liquidity is back while altcoins lag
The crypto market's bifurcation highlights Bitcoin and Ether's institutional appeal, while altcoins face volatility and limited gr...

Bitcoin’s weekend rebound faces an $80,400 test after nearly $730 million in ETF outflows
Bitcoin traded near $82,900 in PerpFinder’s Oct. 10, 09:36 UTC snapshot, with traders watching whether the weekend rebound brings...

XRP Price Prediction: Elliott Wave Setup Points to $3 as XRP Nears a Potential $2 Breakout
XRP Price Prediction: Elliott Wave Setup Points to $3 as XRP Nears a Potential $2 Breakout XRP is approaching a critical technical...
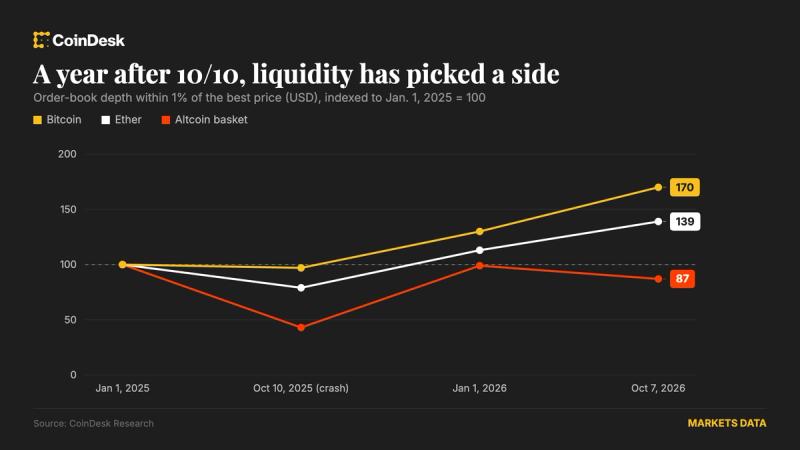
One year after 10/10, bitcoin and ether liquidity have rebuilt, but other altcoins still face risks
Bitcoin and ether order books are deeper than before the crash, while altcoin liquidity keeps eroding and spot trading remains wel...

Prediction markets give Bitcoin a 2% shot at $200,000 in 2026, a record low
The low probability of Bitcoin reaching $200,000 by 2026 reflects tempered market expectations and a shift towards more conservati...