Ethereum Price Broke Out Of Descending Channel, What’s Next?
Ethereum price has been trading within a descending trendline, which is a sign of bearishness. Over the last 24 hours, the Ethereum price has been different as the coin registered a 6% appreciation. As the coin appreciat...
Archive context
Older archive item. Useful for background and entity history, but not a fresh market-moving signal.

Ethereum price has been trading within a descending trendline, which is a sign of bearishness. Over the last 24 hours, the Ethereum price has been different as the coin registered a 6% appreciation.
As the coin appreciated, it broke outside of the descending channel.
Over the last week, the Ethereum price lost more than 7% of its value. The buyers have entered the market, which has helped Ethereum climb on its chart.
Although buyers are attempting to make a comeback, the sellers continue to drive the price action on the one-day chart.
The $1,400 price mark continues to remain a tough resistance zone for Ethereum price. A break past from the aforementioned support line will help ETH revisit its next price ceiling.
The technical outlook for Ethereum continues to remain bearish at the time of writing. Bitcoin’s price recovery has helped major altcoins pick pace over the last 24 hours.
Ethereum Price Analysis: One Day Chart Ethereum was priced at $1,340 on the one-day chart | Source: ETHUSD on TradingViewETH was trading at $1,340 at the time of writing. In the past 24 hours, the buyers have helped the coin break outside of the descending trendline.
The immediate and strong resistance remained at $1,400. The altcoin has struggled to break past that level over the last couple of weeks.
Once the $1,400 mark is broken, Ethereum can attempt to trade close to $1,700. On the other hand, a fall from the $1,340 price mark will push ETH down to $1,100 and then to the $1,000 level.
The past trading session for Ethereum was green, signifying an increase in the number of buyers.
Technical Analysis Ethereum depicted a fall in buying strength on the one-day chart | Source: ETHUSD on TradingViewOn its chart, ETH was attempting to recover. However, the buyers have remained low at the time of writing. Technical indicators have pointed towards a bearish outlook.
The Relative Strength Index was below the half-line, which also indicated that buyers were fewer in number than sellers.
Ethereum price was below the 20-SMA line, which signified low demand. It also meant that sellers were driving the price momentum in the market.
Ethereum depicted sell signal on the one-day chart | Source: ETHUSD on TradingViewETH’s other indicators have also shown that the sellers were in control of the market at the time of writing. The demand for the coin has to go up in order for the coin to touch its next resistance mark.
The Moving Average Convergence Divergence indicates the price momentum and overall price action. MACD witnessed a bearish crossover and formed red histograms at the time of writing.
This reading is connected to the sell signal for the coin. The Chaikin Money Flow displays the capital inflows and capital outflows at a given period in time.
The CMF was below the half-line and that points towards low capital inflows, although there was an uptick on the indicator.
Featured image from UnSplash, Chart: TradingView.comWhy this matters
This ethereum story adds another data point to the current market tape and is useful when read alongside nearby source coverage.
Original source
Read on NewsBTCRelated market context

Ethereum leads stablecoin market cap growth, adding $243M in a week
Ethereum's stablecoin growth highlights potential concentration risks and market consolidation, impacting DeFi liquidity and stabi...

Being right about Bitcoin won’t save your 3x leveraged ETF position
Bitcoin's next recovery could vindicate your investment thesis but leave your leveraged fund deep in the red, because the fund's d...

Luxor’s reported 6–13% annualized Bitcoin yield depends on mining delivery
Luxor, a Bitcoin mining derivatives provider, reported a 6–13% annualized Bitcoin financing spread in its September lookback, publ...

Prediction markets give Bitcoin a 2% shot at $200,000 in 2026, a record low
The low probability of Bitcoin reaching $200,000 by 2026 reflects tempered market expectations and a shift towards more conservati...

Bitcoin Life Insurer Meanwhile Raises $37.5M as Wealthy Families Look to Pass On Their BTC
Bitcoin Magazine Bitcoin Life Insurer Meanwhile Raises $37.5M as Wealthy Families Look to Pass On Their BTC Meanwhile, the first l...
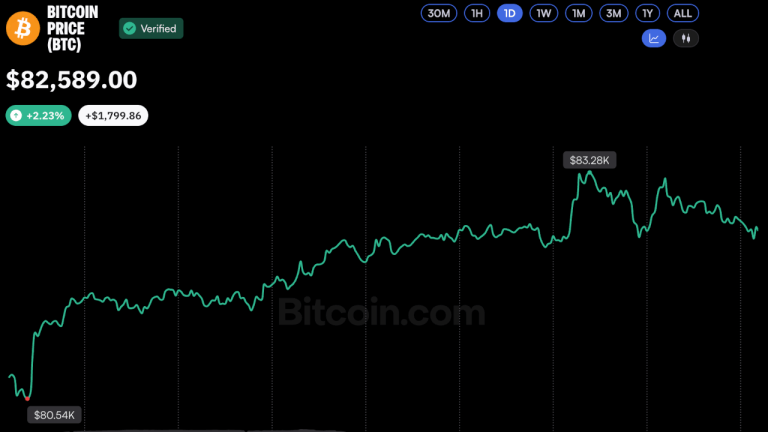
Bitcoin Price Bounces Back to $83K as Crypto Market Liquidations Cool
Bitcoin briefly reclaimed $83,000 on Friday after plunging to a month-to-date low of $80,308 on Thursday, pushing its market cap b...