Ethereum Price Downside Eases: Is Momentum Shifting?
Ethereum price dived below the $2,420 and $2,400 support levels. ETH tested $2,300 and is now showing signs of a decent recovery wave. Ethereum is attempting a recovery wave from the $2,300 zone. The price is trading bel...
Archive context
Older archive item. Useful for background and entity history, but not a fresh market-moving signal.

Ethereum price dived below the $2,420 and $2,400 support levels. ETH tested $2,300 and is now showing signs of a decent recovery wave.
- Ethereum is attempting a recovery wave from the $2,300 zone.
- The price is trading below $2,500 and the 100-hourly Simple Moving Average.
- There is a key bearish trend line forming with resistance at $2,440 on the hourly chart of ETH/USD (data feed via Kraken).
- The pair must clear the $2,500 resistance to start a steady increase in the near term.
Ethereum price extended losses below the $2,420 level. ETH even traded below the $2,400 support before the bulls appeared. A low was formed at $2,308 and the price is now attempting a recovery wave like Bitcoin.
There was a move above the $2,320 and $2,350 resistance levels. The price climbed above the 23.6% Fib retracement level of the downward wave from the $2,564 swing high to the $2,308 low, but there are many hurdles on the upside.
Ethereum price is now trading below $2,500 and the 100-hourly Simple Moving Average. On the upside, the price seems to be facing hurdles near the $2,440 level. It is close to the 50% Fib retracement level of the downward wave from the $2,564 swing high to the $2,308 low.
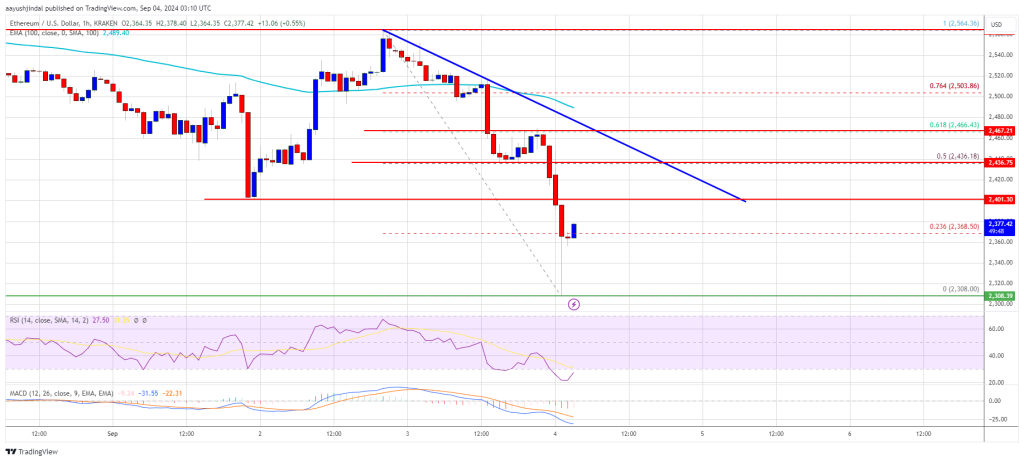
There is also a key bearish trend line forming with resistance at $2,440 on the hourly chart of ETH/USD. The first major resistance is near the $2,500 level. A close above the $2,500 level might send Ether toward the $2,550 resistance. The next key resistance is near $2,650. An upside break above the $2,650 resistance might send the price higher toward the $2,800 resistance zone in the near term.
Another Decline In ETH?If Ethereum fails to clear the $2,440 resistance, it could start another decline. Initial support on the downside is near $2,320. The first major support sits near the $2,300 zone.
A clear move below the $2,300 support might push the price toward $2,250. Any more losses might send the price toward the $2,120 support level in the near term. The next key support sits at $2,040.
Technical Indicators
Hourly MACD – The MACD for ETH/USD is losing momentum in the bearish zone.
Hourly RSI – The RSI for ETH/USD is now below the 50 zone.
Major Support Level – $2,300
Major Resistance Level – $2,440
Why this matters
This ethereum story adds another data point to the current market tape and is useful when read alongside nearby source coverage.
Original source
Read on NewsBTCRelated market context

Ethereum Price Prediction: Hyperliquid Whale Opens $60M ETH Long
Ethereum traded at $2,500 as the price tests the $2,500 area after a volatile stretch with a slightly bearish prediction. But one...

Ethereum Name Service plans major .eth overhaul with one irreversible catch for domain holders
Ethereum Name Service has proposed activating ENSv2 without requiring existing .eth domain holders to migrate to the new system. T...

Hyperliquid (HYPE) Price Today: HYPE Holds $80 Support Despite Mounting Bearish Pressure
CoinGecko data puts Hyperliquid’s market capitalization at approximately $18.04 billion and its daily trading volume near $918 mil...

Bitcoin Claws Back $2,500 Overnight After a $771 Million Crypto Liquidation Wave
Bitcoin traded near $83,700 early Tuesday, up from a low of about $81,200 at 00:50 UTC, CoinGecko prices show. The recovery came w...

XRP Price Prediction: Ripple Makes XRPL Payments Easier With Privy
XRP traded at $1.37, almost flat, with little to no movement as its price prediction and sentiment started to recover. Ripple’s ne...

Bitway Crypto Hits All-Time High, Showing the Need for a Bitcoin-Compatible Chain
Bitway crypto has hit an all-time high as Bitcoin steadies near $83,500, mostly flat over 24 hours, but broader market conviction...