Ethereum Price Registers Breakout But Lacks Momentum, $1,620 Is The Key
Ethereum price is attempting a fresh increase above $1,650 against the US Dollar. ETH could accelerate higher if it clears the $1,670 resistance. Ethereum is attempting a fresh increase above the $1,620 level. The price...
Archive context
Older archive item. Useful for background and entity history, but not a fresh market-moving signal.

Ethereum price is attempting a fresh increase above $1,650 against the US Dollar. ETH could accelerate higher if it clears the $1,670 resistance.
- Ethereum is attempting a fresh increase above the $1,620 level.
- The price is trading above $1,620 and the 100-hourly Simple Moving Average.
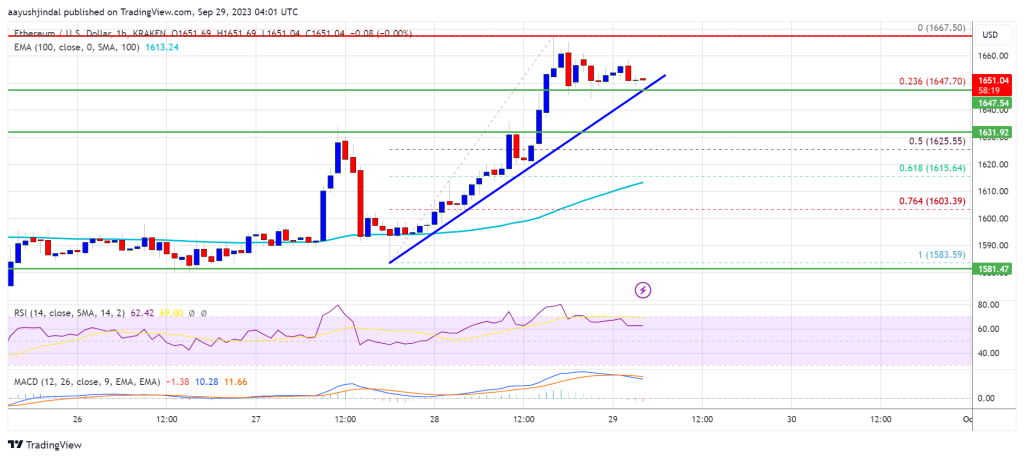
- There is a key bullish trend line forming with support near $1,645 on the hourly chart of ETH/USD (data feed via Kraken).
- The pair could continue to rise if it clears the $1,670 resistance zone.
Ethereum’s price formed a base above the $1,580 level. ETH remained stable and climbed above the $1,620 resistance zone to move into a positive zone, like Bitcoin.
There was a move above the $1,650 level but upsides were limited. A high was formed near $1,667 and there was a minor downside correction. The price is now trading near the 23.6% Fib retracement level of the upward move from the $1,583 swing low to the $1,667 high.
Ethereum is trading above $1,640 and the 100-hourly Simple Moving Average. There is also a key bullish trend line forming with support near $1,645 on the hourly chart of ETH/USD.
Source: ETHUSD on TradingView.com
On the upside, the price might face resistance near the $1,670 level. The next major resistance is $1,720. A clear move above the $1,720 resistance zone could set the pace for a larger increase. In the stated case, the price could visit the $1,800 resistance. The next key resistance might be $1,820. Any more gains might open the doors for a move toward $1,880.
Are Dips Limited in ETH?If Ethereum fails to clear the $1,670 resistance, it could a downside correction. Initial support on the downside is near the $1,645 level and the trend line.
The next key support is $1,620 or the, below which the price could test the $1,600 support. A downside break below the $1,600 support might start another bearish wave. In the stated case, there could be a drop toward the $1,540 level.
Technical Indicators
Hourly MACD – The MACD for ETH/USD is losing momentum in the bullish zone.
Hourly RSI – The RSI for ETH/USD is now above the 50 level.
Major Support Level – $1,620
Major Resistance Level – $1,670
Why this matters
This ethereum story adds another data point to the current market tape and is useful when read alongside nearby source coverage.
Original source
Read on NewsBTCRelated market context

XRP Price Prediction: Elliott Wave Setup Points to $3 as XRP Nears a Potential $2 Breakout
XRP Price Prediction: Elliott Wave Setup Points to $3 as XRP Nears a Potential $2 Breakout XRP is approaching a critical technical...

STRK rallies as Starknet weighs a move from Ethereum layer 2 to its own layer 1
Starknet's potential shift to layer 1 could redefine blockchain security priorities, challenging Ethereum's timeline and reshaping...

Ethereum open interest rose 2.3% in ETH on Binance as its dollar value fell 6.6%
Ethereum open interest in Binance’s ETHUSDT futures contract was 2.27% higher in ETH on Thursday, Oct. 8, over the last 48 hours,...

Starknet considers leaving Ethereum for a quantum-resistant Layer 1
Starknet's STRK token more than doubled over seven days while developers considered leaving Ethereum to build an independent Layer...

AI Could Weaken Ethereum Security as Cryptographic Risks Grow, Vitalik Buterin Warns
Buterin urged developers to prepare for potential AI vulnerabilities in both conventional and quantum-resistant cryptography, whil...

Bitcoin’s weekend rebound faces an $80,400 test after nearly $730 million in ETF outflows
Bitcoin traded near $82,900 in PerpFinder’s Oct. 10, 09:36 UTC snapshot, with traders watching whether the weekend rebound brings...