Ethereum Range Tightens – Liquidity Looms At $2,800 And $2,350
Ethereum is approaching a pivotal moment as it pushes to reclaim the $2,600 level, aiming to break free from weeks of sideways action. After trading within a tight range since early May, ETH is now testing the upper boun...
Archive context
Older archive item. Useful for background and entity history, but not a fresh market-moving signal.

Ethereum is approaching a pivotal moment as it pushes to reclaim the $2,600 level, aiming to break free from weeks of sideways action. After trading within a tight range since early May, ETH is now testing the upper boundary of its consolidation zone, a move that could mark the start of a new bullish phase for the world’s second-largest cryptocurrency.
Market participants are closely watching this level, as a successful breakout above $2,600 would likely attract momentum buyers and confirm renewed strength across the altcoin sector. However, the breakout is far from guaranteed. If bulls fail to sustain this move, Ethereum could face renewed selling pressure, with price potentially revisiting lower support zones.
According to Coinglass data, liquidity clusters are clearly defined at $2,800 and $2,350. These levels will likely act as magnets in the coming days, depending on how Ethereum responds to current resistance. A clean break toward $2,800 would confirm bullish intent and broader altcoin surges, while a rejection could reinforce bearish sentiment.
Ethereum’s Next Move Could Ignite AltseasonAltcoins remain nearly 50% below their all-time highs, but bullish momentum is quietly building. Ethereum, the leader of the altcoin market, has been consolidating in a well-defined range between $2,400 and $2,700 since early May. This prolonged sideways action has kept much of the altcoin sector in a state of indecision. Now, traders and analysts agree: Ethereum must break out to lead the next major move.
Market analyst Ted Pillows identifies two key liquidity levels for ETH: $2,800 on the upside and $2,350 on the downside. These zones represent the most likely destinations for price in the short term, depending on which side of the range breaks first. If Ethereum pushes above $2,800 with strength, it would likely trigger renewed risk appetite and a broad-based altcoin rally. On the other hand, a breakdown below $2,350 could lead to deeper corrections across the board.
So far, bulls have defended the $2,500 level well, and growing open interest suggests that investors are positioning for an expansion. A decisive breakout in either direction will resolve weeks of consolidation and determine the short-term trend. Until then, Ethereum remains the gatekeeper of altcoin momentum—its next move could define the path for the entire market.
ETH Tests Resistance Amid Range-Bound StructureEthereum is currently trading at $2,563, hovering just below the $2,600 mark, a level that has acted as short-term resistance throughout June and early July. As shown in the 12-hour chart, ETH has been trapped in a horizontal consolidation structure between $2,400 and $2,700, with multiple failed attempts to break either side convincingly.
The price remains above the 50, 100, and 200 simple moving averages (SMAs), which is a positive signal for bulls. The 100 SMA at $2,532 and the 200 SMA at $2,206 have offered strong dynamic support during recent pullbacks, reinforcing the current uptrend structure.
Volume remains moderate, suggesting that market participants are waiting for a clear breakout before entering with conviction. A decisive close above $2,600 would open the door for a move toward $2,800, where large liquidity clusters have been identified by Coinglass.
However, failure to maintain this short-term momentum could push ETH back toward the $2,400 support zone. Bulls have defended this level several times, and a break below it would likely invalidate the bullish setup and increase the risk of a deeper correction.
Featured image from Dall-E, chart from TradingView
Why this matters
This ethereum story adds another data point to the current market tape and is useful when read alongside nearby source coverage.
Original source
Read on NewsBTCRelated market context

XRP Price Prediction: Elliott Wave Setup Points to $3 as XRP Nears a Potential $2 Breakout
XRP Price Prediction: Elliott Wave Setup Points to $3 as XRP Nears a Potential $2 Breakout XRP is approaching a critical technical...

One year after 10/10, Bitcoin and Ether liquidity is back while altcoins lag
The crypto market's bifurcation highlights Bitcoin and Ether's institutional appeal, while altcoins face volatility and limited gr...
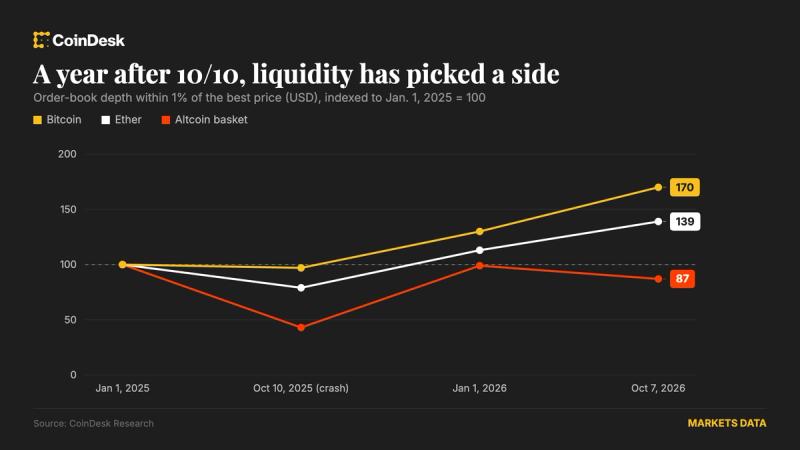
One year after 10/10, bitcoin and ether liquidity have rebuilt, but other altcoins still face risks
Bitcoin and ether order books are deeper than before the crash, while altcoin liquidity keeps eroding and spot trading remains wel...

STRK rallies as Starknet weighs a move from Ethereum layer 2 to its own layer 1
Starknet's potential shift to layer 1 could redefine blockchain security priorities, challenging Ethereum's timeline and reshaping...

Meta AI Predicts This Huge Catalyst Could Lead to $40 XRP
Mark Zuckerberg’s Meta AI predicts an insanely wild bullish price target for XRP by January 1, 2027. The AI bot believes $25–$40 i...

Bitcoin Price Prediction: Can BTC USD Hold $82K Ahead of Next Week’s CPI Drop?
Bitcoin price prediction notes a brief recovery on Saturday, October 10, but the market remains poised for a weekly loss as rising...