Ethereum’s Inverted Chart May Be Setting Up Its Next Major Move: New ATH Soon?
Ethereum’s price action has spent an unusually long time moving sideways, and this behavior has tested the patience of many long-term bullish investors. When speaking of sideways movement, this movement has dragged on fo...
Archive context
Older archive item. Useful for background and entity history, but not a fresh market-moving signal.

Ethereum’s price action has spent an unusually long time moving sideways, and this behavior has tested the patience of many long-term bullish investors. When speaking of sideways movement, this movement has dragged on for many months, although Ethereum did manage to make a new all-time high in 2025.
Interestingly, a technical analysis shared on X by Egrag Crypto shows how Ethereum’s current price action fits into previous playouts when viewed through an inverted monthly chart. This offers a perspective on what appears to be stagnation about to break into new price highs.
A Repeating Cycle With Changing BehaviorThe analysis is based on an inverted monthly Ethereum chart, which offers an interesting perspective that flips conventional interpretations of price movement. Ethereum’s inverted monthly chart shows a consistent pattern that’s changing with time in market structure across multiple cycles.
A look at the inverted chart shows that previous price cycles were characterized by short accumulation phases followed by aggressive moves. As the market matured, those accumulation zones stretched out, and the resulting moves became less violent and more controlled.
The first instance was in 2016, when Ethereum traded in a range for about 10 months before breaking out and going on a violent drop. A similar structure appeared between mid-2018 and mid-2020, when a longer consolidation phase preceded another drop that played out gradually at a softer pace.
The current cycle, however, is playing out with a much longer accumulation. Therefore, the eventual drop should be shorter, according to Egrag Crypto.
Inverted Ethereum Price Chart. Source: @egragcrypto on X
A Drop Here Actually Means A BreakoutThe most important detail in this technical framework is that the chart is inverted. What looks like a downside move on this view actually points to upside expansion on the real Ethereum price chart.
According to the previous outcomes, once Ethereum exits this range, the next move is likely to unfold quickly. It may not match the explosive nature of early-cycle rallies, but it is expected to be more orderly, sustained, and carry Ethereum to new price highs.
When the structure is converted back into real price terms, Egrag Crypto identifies the $3,800 to $4,500 area as the first critical zone. This region represents initial resistance that must be cleared to confirm a bullish continuation. Only after a decisive move above this range would the $6,000 to $7,500 zone come into focus as a realistic upside target.
The analysis also highlights a defined risk scenario. A pullback to the $1,800 to $2,200 region would postpone the breakout and act as a final shakeout before a final lift-off. However, as long as Ethereum holds its broader consolidation structure, such a retest would not invalidate the thesis. At the time of writing, Ethereum is trading at $3,100.
Featured image from Unsplash, chart from TradingView
Why this matters
Ethereum is a tracked market entity in the DigitalMoneyBox archive, making this useful context for readers monitoring repeated mentions and follow-up coverage.
Original source
Read on NewsBTCRelated market context

Elon Musk’s Grok AI Predicts When Bitcoin Will Finally Hit its Ultimate Price Target
X and SpaceX CEO Elon Musk’s Grok AI predicts something potentially historic could be brewing for Bitcoin by January 1, 2027. This...
Monad Wins a Stablecoin Card Infrastructure Deal With Reap and Meru
TL;DR: Reap announced on October 26 that it would add the Monad blockchain to its stablecoin-linked card infrastructure, with Lati...
Visa’s Stablecoin Funding Moves Beyond the Pilot Stage
TL;DR: Visa says Inyo Global is the first enabler to bring its stablecoin-enabled Visa Direct prefunding into production for eligi...

Ethereum Developers Merge Glamsterdam Fix to Keep Validator Deposits Out of Builder Accounts
Ethereum developers merged a fix on Oct. 26 for a Glamsterdam bug that could have credited a staker’s validator deposit to someone...
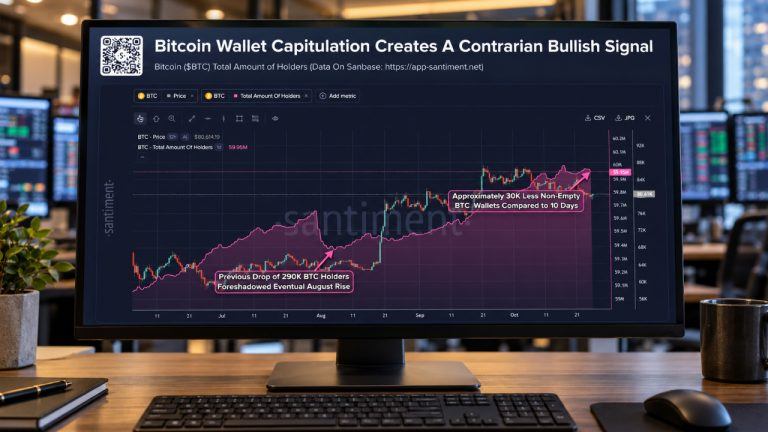
Bitcoin Bottom May Be Near as 30,000 Wallets Disappear: Santiment
Bitcoin may be approaching a local bottom as smaller holders retreat, according to Santiment’s latest analysis. Falling wallet par...
Aviva Tokenises Part of £22 Billion Sterling Fund on XRP Ledger
TL;DR: Aviva Investors and Ripple announced a tokenised share class for the Aviva Investors Sterling Liquidity Fund on October 26....