HBAR Struggles Below $0.25: Key Support at $0.23 in Focus
Technical analysis across multiple timeframes reveals a market at a critical juncture, where support at $0.23 takes center stage as traders seek signals for either a bounce back or a further decline. The outlook remains...
Archive context
Older archive item. Useful for background and entity history, but not a fresh market-moving signal.

Technical analysis across multiple timeframes reveals a market at a critical juncture, where support at $0.23 takes center stage as traders seek signals for either a bounce back or a further decline.
The outlook remains uncertain as volume, momentum, and price action suggest a delicate balance between selling pressure and potential recovery.
Price Action Shows Bearish Momentum Amid Low VolumeAccording to analysis by Fresh ◎, the price of HBAR has declined by over 4% in the last 24 hours to $0.2353. This move reflects growing bearish sentiment as the token trades well below previous support levels ranging from $0.24 to $0.25. Red candlesticks dominate the short-term chart, confirming a downtrend.
Source: X
Volume analysis reveals lower-than-average activity, with selling volume outweighing buying. This reduced participation signals uncertainty, often indicating that the market is waiting for a clear catalyst before deciding on its next direction. The current low volume suggests either continuation of the downtrend or the possibility of a reversal if fresh buying interest emerges near critical levels.
Support at $0.23 remains a vital threshold. Holding this level could spark a bounce, but a breakdown may lead to declines toward $0.22. Resistance is noted near $0.24–$0.25, levels that must be surpassed to signal a potential recovery. Traders should closely watch price action around these key zones for decisive breakout or breakdown signals.
Consolidation Phase Indicates Market IndecisionIn addition, BraveNewCoin’s 24-hour overview shows HBAR oscillating near $0.24, with a minor 2.34% drop during this period. The price fluctuates within a narrow band, indicating a consolidation phase rather than directional momentum. This sideways movement reflects indecision among market participants as neither bulls nor bears dominate decisively.
Source: BraveNewCoin
Volume during this phase is moderate, balanced between buyers and sellers. Such equilibrium often characterizes markets pausing before larger moves. Without a spike in volume, meaningful breakouts are less likely, leaving the price range-bound.
Should support at $0.24 give way, further downward movement toward $0.22 is possible. Conversely, pushing above the $0.25 resistance could trigger upward momentum, potentially targeting higher resistance levels. Monitoring volume and price near these thresholds will be essential for future trend confirmation.
Momentum Indicators Signal Neutral to Mildly Bearish StanceAt the time of writing, TradingView’s technical indicators show the RSI at 44.63, just below the neutral midpoint of 50. This reading suggests that while sellers have the upper hand, the market is not yet in extreme oversold territory, leaving room for either continued declines or a reversal.
Source: BraveNewCoin
The MACD currently features a bearish crossover with the MACD line below the signal line, signaling short-term downward momentum. However, the narrow histogram bars suggest bearish strength may be weakening, opening the door to potential stabilization or upward movement if momentum shifts.
HBAR is currently testing crucial support and resistance between $0.23 and $0.25. This range will likely dictate near-term price direction, with a break above or below these levels signaling the next significant move.
Why this matters
This research story adds another data point to the current market tape and is useful when read alongside nearby source coverage.
Original source
Read on Brave New CoinRelated market context

Bitcoin slips below $83,000, wiping out nearly $42 million in longs before the US open
Leverage-induced volatility highlights the risks in Bitcoin trading, emphasizing the need for cautious positioning and monitoring...
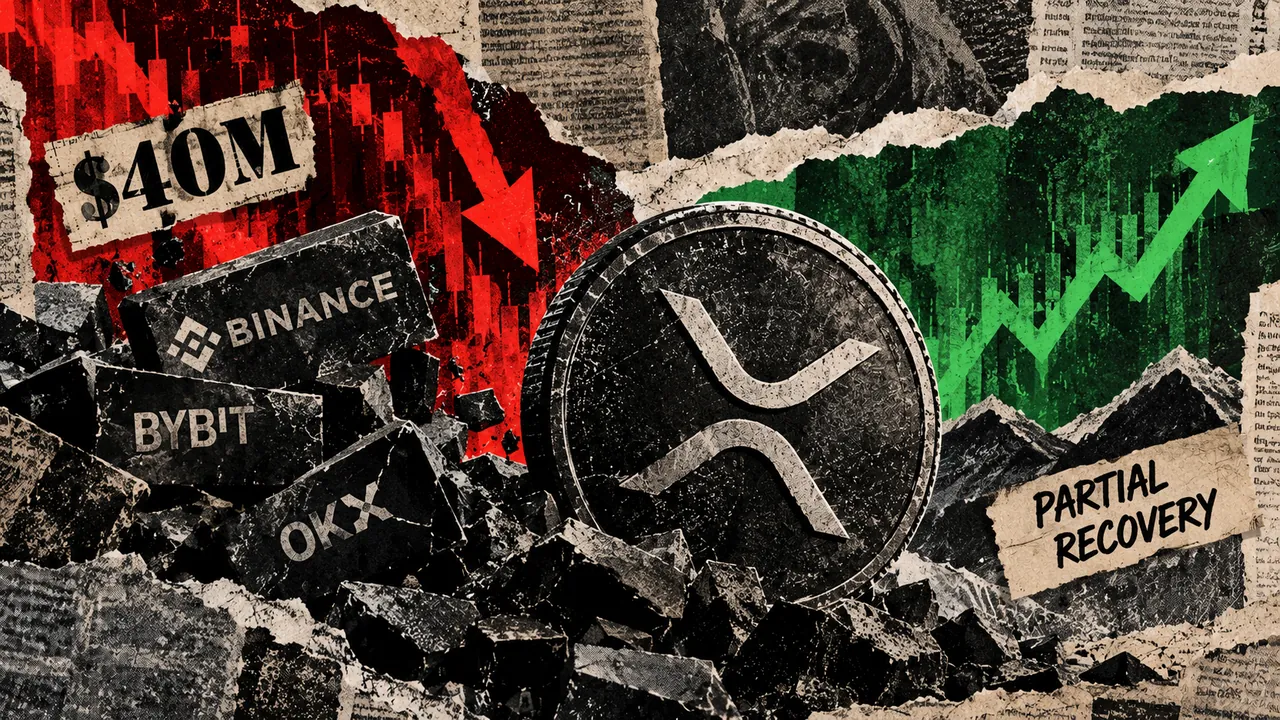
XRP rebounded as Binance spot turnover fell nearly 80%
XRP futures exposure began rebuilding by October 11 after market-data provider XRPL.to recorded $40.70 million in long liquidation...

Meta AI Predicts This Huge Catalyst Could Lead to $40 XRP
Mark Zuckerberg’s Meta AI predicts an insanely wild bullish price target for XRP by January 1, 2027. The AI bot believes $25–$40 i...

SUI Crypto Up +2% Following $30M DATA Network Investment
SUI crypto trades at $1.12, up +2.2% over 24 hours, as traders weigh a sharp recent rebound against overhead resistance. The Sui F...
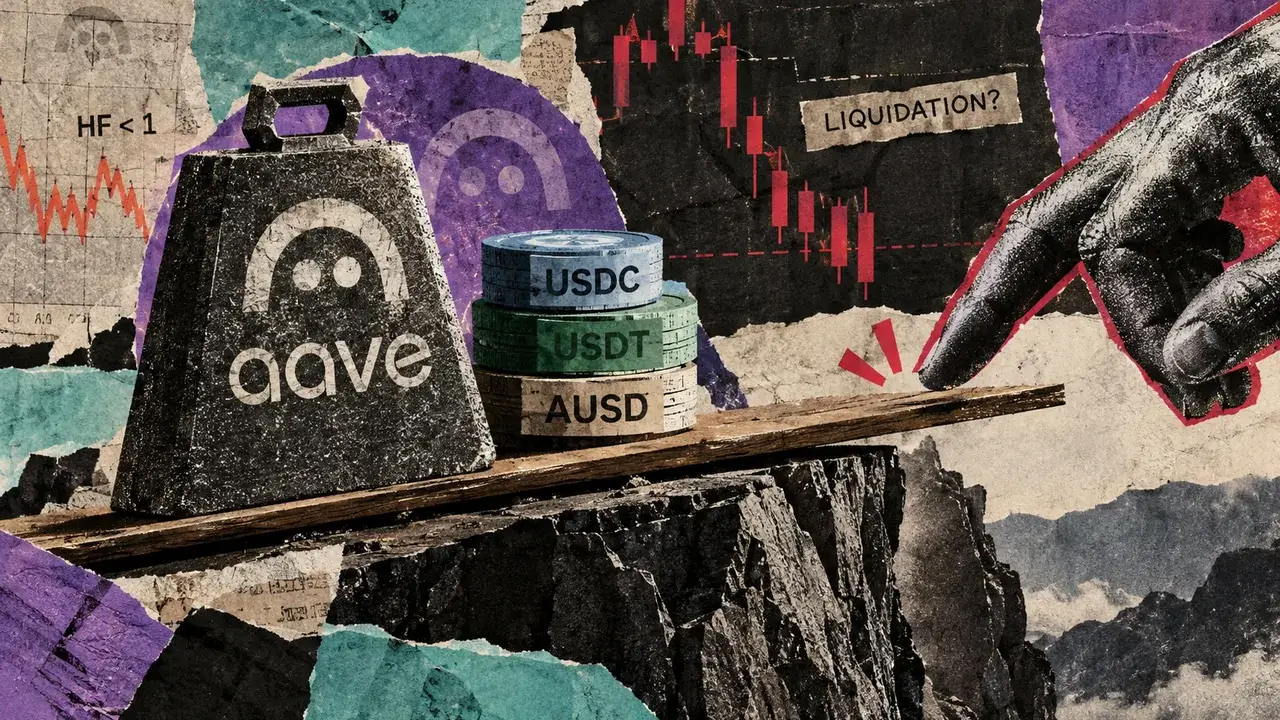
Some Aave loans sit near liquidation with collateral that can take hours to cash out
Some Aave loans backed by yield-bearing collateral had narrow liquidation buffers in LlamaRisk’s Oct. 9 snapshots. Every top PT-AU...

XRP Price Prediction: Can Ripple Hold $1.40 or is $1.20 Next?
Today’s XRP price prediction centers on Ripple’s expansion into Wall Street financing, reigniting a familiar concern for XRP holde...