Hedera Bulls Eye $0.30 as Positive Price Action Meets Market Sentiment
The price has consolidated in a downward trendline after a rally, signaling possible continued upward momentum. With support above the $0.23 level, the asset is poised to eye a potential breakout above $0.28, which could...
Archive context
Older archive item. Useful for background and entity history, but not a fresh market-moving signal.

The price has consolidated in a downward trendline after a rally, signaling possible continued upward momentum.
With support above the $0.23 level, the asset is poised to eye a potential breakout above $0.28, which could drive the price higher toward the $0.30 mark or beyond. However, market sentiment has recently shifted as its futures funding rate turned negative, signaling an increase in short positions and a bearish outlook in the near term.
Hedera’s Bullish Flag Formation Signals Potential BreakoutHedera price chart has formed a bullish flag pattern, indicating a potential upward breakout, according to analyst Oleos Capital. After a sharp rally, the asset has been consolidating within a downward-sloping trendline, suggesting that the price is preparing for a move higher.
HBARUSD Chart | Source:x
The flag formation typically indicates a brief consolidation phase before the price continues in the direction of the prior trend, in this case, upward. As it remains above the $0.23 support level, the chart shows a strong potential for the price to rise if it breaks through the immediate resistance near $0.28.
Key moving averages, including the 50-day and 200-day exponential moving averages (EMAs), are providing support levels that further suggest the likelihood of a breakout. Additionally, the volume analysis reveals strong accumulation during the previous bullish phase, implying that market participants are actively supporting the upward trend.
Volume Surge and Positive Market SentimentOver the 24 hours from August 25 to August 27, 2025, the token exhibited notable fluctuations, with the price initially reaching $0.24 before briefly peaking at $0.246. The price then pulled back but remained above the critical $0.23 support level, indicating moderate bullish sentiment. This sustained upward movement, accompanied by brief consolidation phases, signals that the bulls remain in control of the market.
HBARUSD 24-Hr Chart | Source: BraveNewCoin
During this time, there was a surge in trading volume, particularly around 18:00 UTC on August 26, when the price made a brief spike. The rising volume signals stronger interest, showing the price gain comes from real demand rather than speculation. Such healthy market activity points toward the potential for continued upward movement, should it manage to break resistance.
Shift in Market Sentiment: HBAR Futures Funding Rate Turns NegativeA change in market sentiment has been observed, as analyst STEPH IS CRYPTO reports that the futures funding rate has turned negative for the first time this week. This negative funding rate suggests that more market participants are taking short positions, indicating bearish sentiment in the market.
As of August 26, 2025, the shift in sentiment has caused more traders to bet against the price, signaling growing uncertainty about the cryptocurrency’s short-term prospects.
HBARUSD Chart | Source:x
However, this shift contrasts with previous periods when market sentiment was more positive, as evidenced by the funding rate remaining positive. Additionally, the negative funding rate indicates that traders expect further downside, and if this sentiment persists, the altcoin could face downward pressure. Some analysts believe the negative funding rate is temporary, with the bullish flag still pointing to higher prices.
Future Price Outlook: Hedera’s Potential to Break $0.30Despite the negative shift in sentiment, the broader market structure and altcoin’s technical indicators point toward the possibility of further price appreciation. If it breaks through the $0.28 resistance level, the next significant target could be $0.30. The chart pattern, which shows consolidation at higher levels, suggests that the cryptocurrency is in a phase of accumulation, with the potential to continue its upward trend.
Market participants will closely watch how it behaves around the $0.28 resistance level. A successful breakout could lead to a more sustained rally toward the $0.30 mark, as the volume supports the upward movement. The combination of technical indicators and market sentiment will likely dictate its price action over the coming days.
Why this matters
This research story adds another data point to the current market tape and is useful when read alongside nearby source coverage.
Original source
Read on Brave New CoinRelated market context

XRP Price Prediction: Elliott Wave Setup Points to $3 as XRP Nears a Potential $2 Breakout
XRP Price Prediction: Elliott Wave Setup Points to $3 as XRP Nears a Potential $2 Breakout XRP is approaching a critical technical...

Bitcoin Price Prediction: Can BTC USD Hold $82K Ahead of Next Week’s CPI Drop?
Bitcoin price prediction notes a brief recovery on Saturday, October 10, but the market remains poised for a weekly loss as rising...

Uniswap v4 and v3 capture 47.2% of $161.4 billion in stablecoin DEX volume
Uniswap's dominance in stablecoin DEX volume highlights its critical role in onchain finance, impacting trader strategies and liqu...
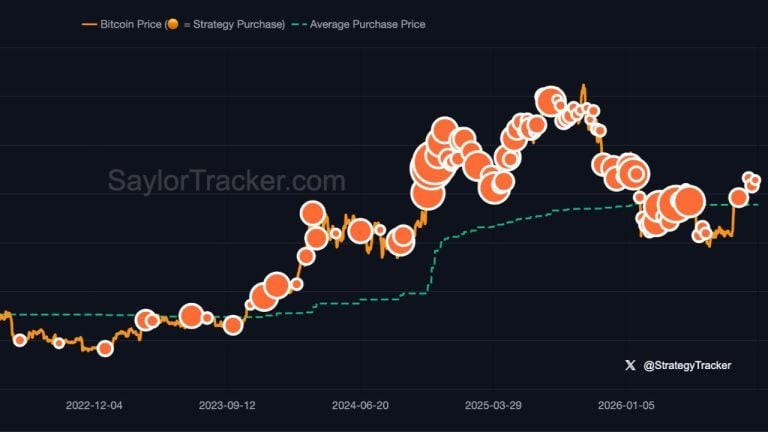
More Orange: Saylor Hints at Growing Strategy’s 848K Bitcoin Stash
Strategy could expand its bitcoin holdings after Michael Saylor posted another orange-themed buying hint. His latest message follo...

Bitfinex ETH longs climb to their highest level in over four years
The surge in Bitfinex ETH longs suggests heightened market optimism, but it also raises the risk of a long squeeze if prices decli...

Vitalik Buterin says AI could accelerate Ethereum’s roadmap by decades
AI's role in Ethereum's development could redefine blockchain innovation timelines, but it also heightens the need for robust secu...