Optimism (OP) Struggles Below $0.70 as Sellers Keep Control
While some signs of accumulation are emerging, traders remain cautious as the asset struggles to reclaim key resistance levels. Short-Term Charts Reveal Persistent Downtrend On the 1-hour chart from Binance, OP/USDT has...
Archive context
Older archive item. Useful for background and entity history, but not a fresh market-moving signal.

While some signs of accumulation are emerging, traders remain cautious as the asset struggles to reclaim key resistance levels.
Short-Term Charts Reveal Persistent DowntrendOn the 1-hour chart from Binance, OP/USDT has been in a clear downtrend, falling from above $0.84 to the current level near $0.67. The structure is marked by lower highs and lower lows, with bearish momentum accelerating through the midpoint of the decline.
Recent candles show sideways movement, hinting at either short-term consolidation or the market pausing after heavy selling pressure.
Source: Open Interest
Volume data adds context: over the last ten periods, buy volume (~453.6K) has exceeded sell volume (~210.8K). However, this has not translated into price strength, suggesting that buyers may be quietly accumulating, but the broader momentum still favors sellers. Unless the token can break above key resistance, rallies may remain shallow and short-lived.
Market Data Suggests Only Modest Recovery PotentialAccording to BraveNewCoin, Optimism is currently priced at $0.67, showing a 4.09% increase in the last 24 hours. The project carries a market capitalization of $1.19 billion, with daily trading volume standing at around $146.7 million.
While these numbers reflect a degree of healthy liquidity, they also underscore the fact that the coin is still trading far below its recent highs, remaining outside of the stronger performers in the crypto market.
Source: BraveNewCoin
The asset has consistently struggled to reclaim the $0.75–$0.80 range, which has become a major overhead barrier for any sustained recovery attempts. Holding above the $0.64 support zone is seen as critical to avoid further losses, as a breakdown could quickly expose the memecoin to the historical low near $0.4570.
Technical Indicators Confirm Bearish ControlA deeper look at the daily chart from TradingView shows Optimism trading at $0.6713, which is well below the Bollinger Band basis line of $0.7541. This indicates that the asset is firmly in bearish territory, as price action continues to hover near the lower band at $0.6409.
Riding the lower edge of the bands often reflects sustained selling pressure with no immediate signs of reversal.
Source: TradingView
The Chaikin Money Flow (CMF) is currently at -0.07, which points to moderate but persistent selling activity outweighing buying interest. This indicator has remained mostly negative throughout September, reflecting capital outflows and limited appetite from institutional or large-scale buyers. Without strong positive shifts in CMF, accumulation efforts remain weak and fragmented.
Key levels now define the next likely moves for the asset. On the downside, support rests at $0.6409, followed by the historical low near $0.4570, which could become a target if bearish pressure continues. On the upside, immediate resistance lies at the Bollinger band line of $0.7541, with stronger resistance at the upper band near $0.8672. A confirmed close above these levels, especially with volume support, would be required to confirm any bullish reversal.
Why this matters
This research story adds another data point to the current market tape and is useful when read alongside nearby source coverage.
Original source
Read on Brave New CoinRelated market context

Bitcoin’s failed breakout reveals a dangerous mix of thin volume and easy profits
Bitcoin has fallen nearly 5% this week as weak trading volume and profit-taking blunt attempts to reclaim $85,000. The largest cry...

Bitcoin’s slide below $81,000 exposes why a Fed pause may not save the crypto market
Bitcoin slid below $81,000 on Oct. 8, with an intraday low near $80,800, even as traders expect the Fed to hold in October. The Se...
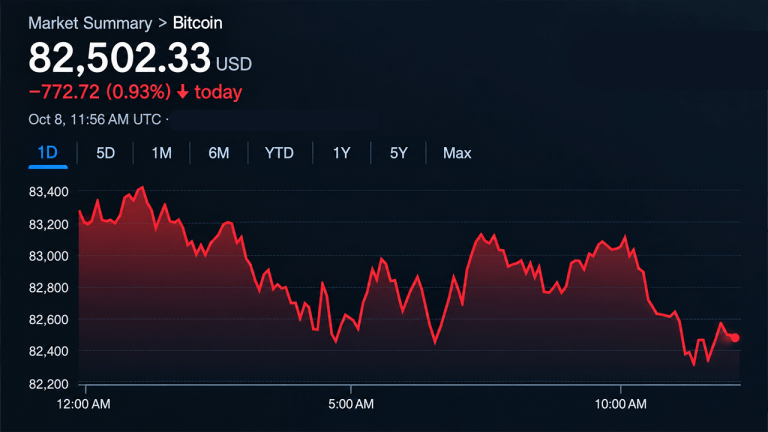
Bitcoin Price Holds Above $82K Despite Mounting Bearish Pressure
Bitcoin’s price is struggling to find its footing on Oct. 8, 2026, after a sharp selloff knocked prices from the mid-$85,000s into...

Bitcoin (BTC) Price Today: $81.1K Becomes Critical as Traders Eye Double-Bottom Setup
Bitcoin recently climbed above $85,000 before encountering renewed selling pressure. Glassnode’s latest Week On-Chain report shows...

Bitcoin Falls Below $81,000 as Oil Spikes, Fed Talks Tough
Bitcoin Magazine Bitcoin Falls Below $81,000 as Oil Spikes, Fed Talks Tough Bitcoin’s price has dropped further, sliding with othe...

Bitcoin Core’s privacy fix reaches v32 code while the v31 patch remains open
Bitcoin Core has merged a privacy fix into its 32.x source branch addressing behavior that could correlate private-broadcast conne...