Optimism Price Below $1: Key Support at $0.70 Holds as Bearish Pressure Mounts
The market remains cautious as bearish sentiment intensifies, though some indicators suggest potential for a rebound if key support holds. Weekly Trend Shows Persistent Downward Movement On the weekly chart, Optimism has...
Archive context
Older archive item. Useful for background and entity history, but not a fresh market-moving signal.

The market remains cautious as bearish sentiment intensifies, though some indicators suggest potential for a rebound if key support holds.
Weekly Trend Shows Persistent Downward MovementOn the weekly chart, Optimism has been trending downward inside a well-defined descending channel. This pattern reflects sustained bearish momentum as the price continues to respect resistance levels and fails to break upward decisively. The $0.70 support level has proven significant, acting as a floor during previous declines.
Source: X
The Relative Strength Index (RSI) is hovering around 40.30, approaching oversold territory, which may signal a potential reversal if buyers intervene at current levels. Complementing this, the Ichimoku indicator currently gives a “Buy” signal, hinting at possible bullish confirmation in the weeks ahead.
However, for such a reversal to gain traction, the price must sustain above the $0.70 support and eventually break through the channel’s resistance line. A successful breakout could open the door to a move toward resistance near $1.20.
Recent Price Decline and Market ActivityOver the past 24 hours, the token value retraced from a high of $0.76 to $0.72, marking a near 7% decline. This drop reflects bearish market sentiment and highlights the challenges of maintaining momentum above the crucial $0.70 support level. Trading volume remains elevated at approximately $198.56 million, indicating active market participation amid uncertainty.
Source: BraveNewCoin
Despite the decline, Optimism’s market capitalization stands robust at $1.25 billion with a supply of 1.75 billion coins in circulation. This considerable supply can contribute to price volatility depending on liquidity and trading activity.
Traders are closely monitoring the $0.70 support; a break below this zone could expose the memecoin to further declines, potentially toward the $0.60 level, which aligns with the lower boundaries of recent trading ranges. Conversely, signs of consolidation around current levels may signal a pause in the downtrend and offer a chance for a price retest near resistance at $0.76.
Volatility and Momentum Indicators Signal Caution and Possible AccumulationDaily charts highlight increased market volatility, as depicted by Bollinger Bands expanding with the price touching below the lower band. This formation underscores the strength of current bearish pressure, with prices trading just under the middle band—suggesting prevailing downside momentum.
Source: TradingView
The Chaikin Money Flow (CMF) indicator shows a mild positive value of 0.12, indicating gradual money inflows, suggesting some degree of accumulation. Although momentum remains bearish, this inflow could lay the groundwork for a near-term reversal if sustained buying pressure increases.
Resistance near $0.75, which corresponds with the upper Bollinger Band, is a crucial level to observe. Breaking above this threshold may indicate a shift toward bullish strength. Traders are advised to monitor price dynamics closely around this zone to assess the likelihood of a breakout that could alter the current trend.
Why this matters
This research story adds another data point to the current market tape and is useful when read alongside nearby source coverage.
Original source
Read on Brave New CoinRelated market context

Bitcoin slips below $83,000, wiping out nearly $42 million in longs before the US open
Leverage-induced volatility highlights the risks in Bitcoin trading, emphasizing the need for cautious positioning and monitoring...

NEAR Protocol jumps 16% as trading activity surges over weekend
NEAR's surge highlights growing investor interest in cross-chain solutions and ETFs, potentially influencing broader altcoin marke...

XRP Price Slid as Bitwise Drives $11 Million ETF Inflows
U.S. spot XRP ETFs drew $11.31 million in net inflows between October 5 and October 9, even as XRP fell from about $1.52 to $1.40...

XRP rebounded as Binance spot turnover fell nearly 80%
XRP futures exposure began rebuilding by October 11 after market-data provider XRPL.to recorded $40.70 million in long liquidation...

Meta AI Predicts This Huge Catalyst Could Lead to $40 XRP
Mark Zuckerberg’s Meta AI predicts an insanely wild bullish price target for XRP by January 1, 2027. The AI bot believes $25–$40 i...
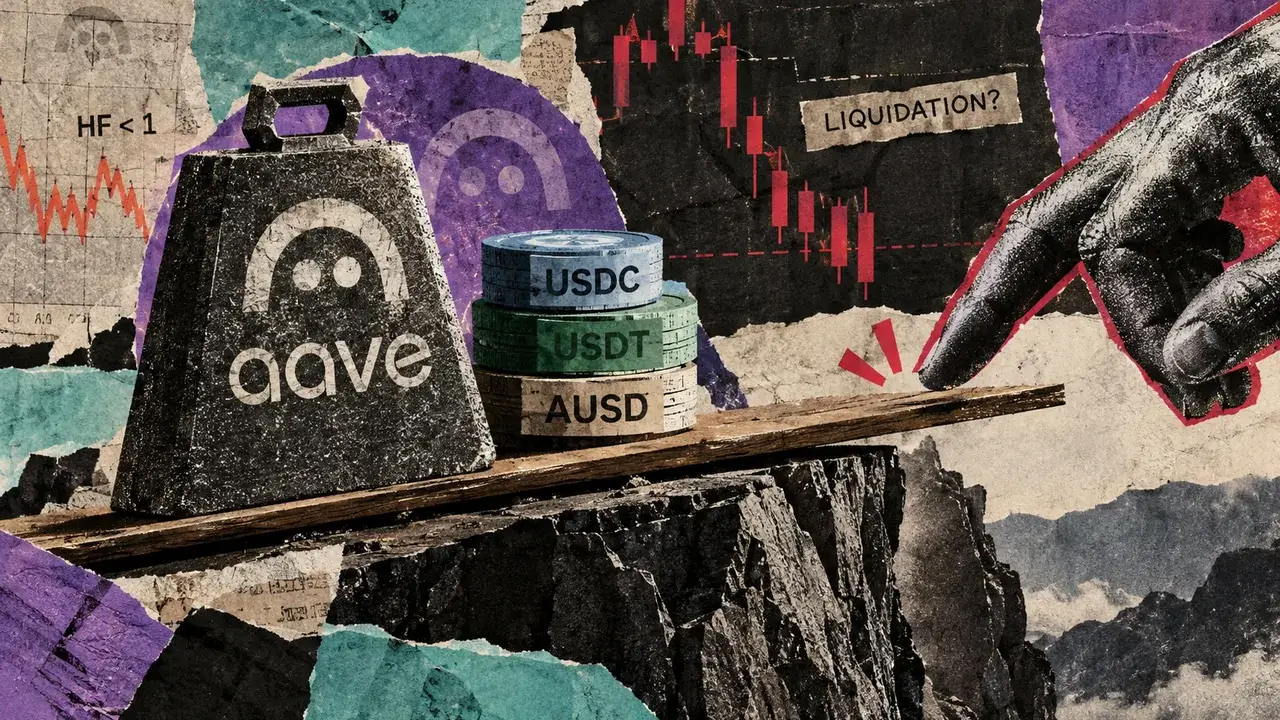
Some Aave loans sit near liquidation with collateral that can take hours to cash out
Some Aave loans backed by yield-bearing collateral had narrow liquidation buffers in LlamaRisk’s Oct. 9 snapshots. Every top PT-AU...