Optimism Price Eyes Breakout as Falling Wedge and 8% Surge Signal Rally
Recent charts reveal buyer interest strengthening amid compression in price action, suggesting that the token could be gearing for a sharp upward move if key resistance levels are surpassed. Traders are watching closely...
Archive context
Older archive item. Useful for background and entity history, but not a fresh market-moving signal.

Recent charts reveal buyer interest strengthening amid compression in price action, suggesting that the token could be gearing for a sharp upward move if key resistance levels are surpassed. Traders are watching closely as the token approaches a decisive inflection point.
Falling Wedge on Weekly Chart Signals Bullish ReversalA weekly chart shared by Solberg Invest (@SolbergInvest) highlights OP’s formation of a large falling wedge—a price pattern often considered bullish. The wedge, defined by descending resistance and support, features lower highs and lows, but momentum is waning, indicating seller exhaustion. This setup typically precedes a reversal, where price breaks out above the wedge’s upper boundary.
Source: X
Should the memecoin break above this resistance trendline, the chart projects a strong move toward the $3.00 to $4.00 range, signaling a potential sustained rally if volume and momentum support the move. However, traders should be cautious, as failure to clear resistance could lead to extension of the downtrend and further decline.
Volume Surge Supports Short-Term Bullish BiasRecent 24-hour data from BraveNewCoin shows OP climbing 8.28% to about $0.77, fueled by a sharp volume increase to $306.65 million. This growing liquidity validates the strength of the upward move, reflecting renewed market interest. Intraday volatility saw price spike close to $0.80 before pulling back, illustrating seller presence near local highs but also strong demand.
Source: BraveNewCoin
Sustaining above $0.80 would sustain bullish momentum and could open doors to higher short-term targets. Despite recent gains, the asset remains significantly undervalued relative to its previous peaks, attracting speculative accumulation. Ongoing buying pressure will be critical in confirming a resumption of the uptrend.
From a broader perspective, the cryptocurrency remains undervalued compared to its past highs, making these accumulation zones attractive for speculative investors. However, sustained buying pressure will be needed to confirm a stronger uptrend.
Bollinger Bands and MACD Show Tipping Point for MomentumOn the other hand, TradingView’s technical indicators reveal OP trading close to $0.7768, near the upper Bollinger Band at $0.8444, suggesting potential resistance ahead. Support near the Bollinger midline at $0.7452 continues to hold, indicating underlying bullish pressure.
Source: TradingView
The MACD is in the early stages of a bullish crossover, with the MACD line nearing the signal line and a narrowing negative histogram, signaling waning bearish momentum.
Should the cryptocurrency break and maintain above the upper Bollinger Band, volatility could expand, potentially driving price gains to between $0.90 and $1.00. Alternatively, failure to break resistance may prompt a retest of the $0.74 support zone.
The memecoin poised technical setup, combined with volume-fueled gains, positions it on the edge of a meaningful breakout. Market participants should closely observe the $0.80 resistance level and indicator signals for confirmation of sustained bullish momentum or potential pullbacks.
Why this matters
This research story adds another data point to the current market tape and is useful when read alongside nearby source coverage.
Original source
Read on Brave New CoinRelated market context

SUI Crypto Up +2% Following $30M DATA Network Investment
SUI crypto trades at $1.12, up +2.2% over 24 hours, as traders weigh a sharp recent rebound against overhead resistance. The Sui F...

XRP Price Prediction: Elliott Wave Setup Points to $3 as XRP Nears a Potential $2 Breakout
XRP Price Prediction: Elliott Wave Setup Points to $3 as XRP Nears a Potential $2 Breakout XRP is approaching a critical technical...

Bitcoin’s rebound approaches the $85,000 zone where past buyers may sell
Bitcoin and Ethereum extended their weekend recovery, although on-chain indicators and derivatives positioning suggest the rebound...

Meta AI Predicts This Huge Catalyst Could Lead to $40 XRP
Mark Zuckerberg’s Meta AI predicts an insanely wild bullish price target for XRP by January 1, 2027. The AI bot believes $25–$40 i...

Bitcoin records first bullish 13/34-week EMA crossover in 3.5 years
The bullish EMA crossover suggests potential upward momentum for Bitcoin, but macroeconomic factors like ETF flows and inflation r...
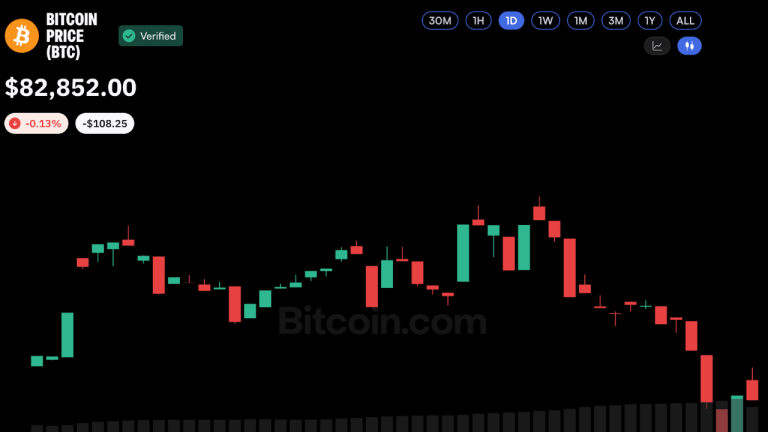
Bitcoin Price Defies $681M ETF Outflow as Oil Trades Above $100
Bitcoin is holding above $80,000 even as Brent crude trades above $100 amid renewed Middle East tensions. The resilience is notabl...