Optimism Price Forecast Turns Positive as Chart Signals Breakout Rally
Meanwhile, BitMonty noted a confirmed breakout from a long-term bearish wedge, backed by bullish divergence on the Relative Strength Index (RSI). These developments suggest OP may be forming a base for a sustained upward...
Archive context
Older archive item. Useful for background and entity history, but not a fresh market-moving signal.

Meanwhile, BitMonty noted a confirmed breakout from a long-term bearish wedge, backed by bullish divergence on the Relative Strength Index (RSI). These developments suggest OP may be forming a base for a sustained upward move.
Despite a recent 6.4% drop to around $0.67, OP’s price behavior shows early signs of stabilization. Trading volume remains steady, and bullish traders are watching for a confirmed rebound. As sentiment shifts, the focus now turns to whether Optimism can hold support and begin its climb toward higher targets.
Optimism Price Forecast Turns Positive as Chart Signals Breakout RallyAccording to analyst UNKNOWN TRADER, the Optimism token is nearing a critical support area at $0.682. The asset recently fell below a descending trendline and then experienced a modest recovery before retracing again. The chart shared by the analyst shows a projected bounce forming around this support, indicating a potential technical entry point if the level holds.
Source:X
The chart also identifies resistance levels at $0.7765, $0.7929, and $0.8058. These serve as upside markers should a reversal unfold from the $0.682 zone. UNKNOWN TRADER advocates for patience and confirmation before entering any trade, framing this setup as a structured, low-risk opportunity rather than a speculative reaction to current volatility.
Weekly Breakout Aligns With RSI DivergenceSupporting the short-term structure, BitMonty has presented a longer-term view of OP, noting that the asset has officially broken out of a prolonged bearish wedge on the weekly chart. The breakout is backed by a bullish divergence in the Relative Strength Index, suggesting declining downside pressure and the emergence of early bullish momentum.
Source:X
BitMonty’s roadmap shows price projections toward $1.975 and, if momentum continues, up to $2.775. These levels align with prior Fibonacci retracement zones and historical reaction points. The RSI trendline currently shows an upward trajectory, which adds to the validity of the weekly breakout structure, suggesting underlying strength despite recent price weakness.
Short-Term Price Movement Reflects VolatilityOver the past 24 hours, Optimism experienced a sell-off of more than 6.4%, with Optimism price sliding from around $0.7203 to an intraday low near $0.64. This decline was not accompanied by high liquidation spikes or erratic volume shifts, with trading volume remaining stable near $234.86 million. Hence, the lack of sharp liquidation events suggests that the move was largely driven by market rotation or repositioning, rather than panic selling.
Source: BraveNewCoin
In the latter part of the session, a modest recovery took shape, lifting the Optimism price slightly above $0.668. The rebound appears to be supported by short-term buyers entering around previous support zones.
However, traders remain watchful for confirmation above $0.70 before assuming continued upside. Momentum indicators such as RSI and MACD are being closely followed to assess whether this bounce carries further strength.
Forecast Hinges on Support, Stability, and Volume GrowthFor the forecast to remain positive, OP will need to maintain support in the $0.65–$0.68 range. Analysts have emphasized that stability at these levels could provide a platform for further upside movement. Should the Optimism price rebound and breach the $0.7765 resistance, the next leg higher could confirm a bullish reversal pattern.
Volume expansion and broader market alignment will be key factors in validating any extended rally. Until then, technical traders will continue to monitor confirmation signals, including trendline retests, stochastic oscillators, and continuation patterns. While early signs of reversal are in place, sustained growth will depend on a combination of support, resiliency, and renewed demand across the altcoin sector.
Why this matters
This research story adds another data point to the current market tape and is useful when read alongside nearby source coverage.
Original source
Read on Brave New CoinRelated market context

Hyperliquid (HYPE) Price Today: HYPE Holds $80 Support Despite Mounting Bearish Pressure
CoinGecko data puts Hyperliquid’s market capitalization at approximately $18.04 billion and its daily trading volume near $918 mil...

Peter Schiff Surprised by Bitcoin’s Strength as Michael Saylor’s Strategy Boosts BTC Holdings to 848,250
Schiff continues to expect further declines, but Strategy’s latest purchases highlight the company’s commitment to Bitcoin as a lo...
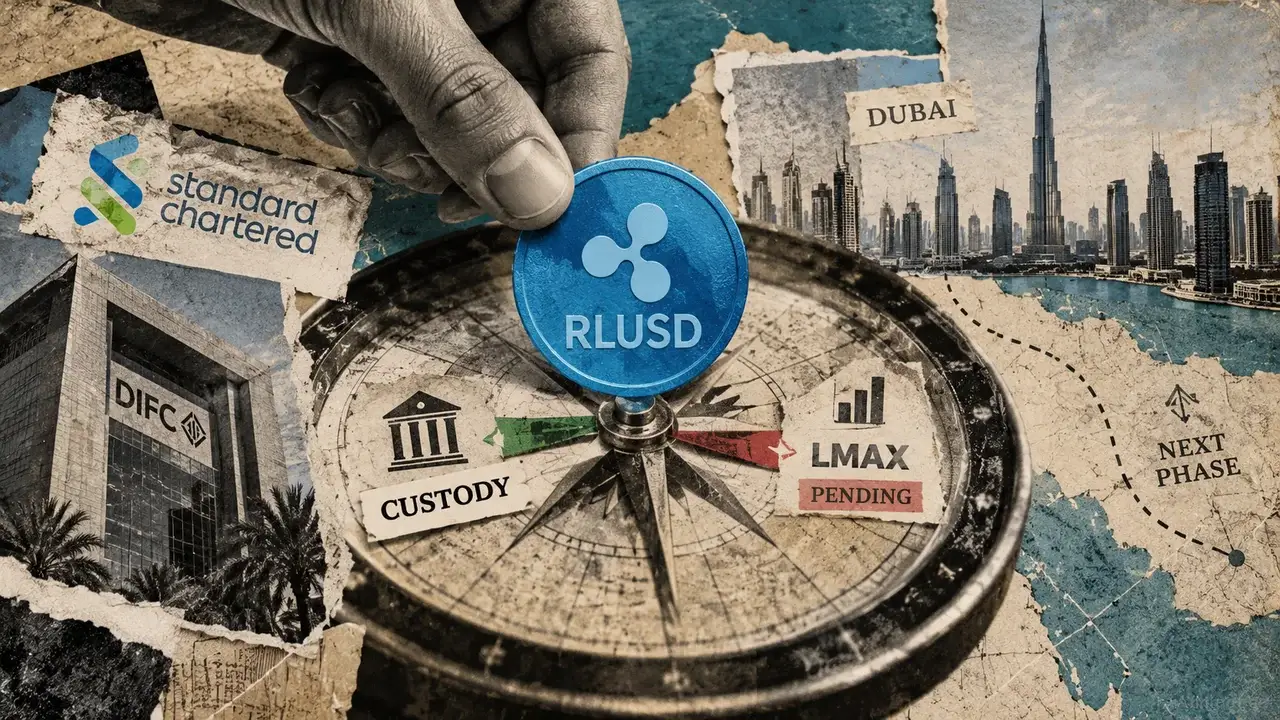
Standard Chartered brings Ripple’s RLUSD into banking custody after $765 million quarterly surge
Standard Chartered has launched custody for Ripple's RLUSD stablecoin as it prepares to expand its use as collateral for instituti...

Standard Chartered Will Hold Ripple's Stablecoin in Dubai—And Let Clients Trade With It Without Moving It
The bank's Dubai branch now offers custody for Ripple's RLUSD stablecoin and plans a link with LMAX that lets institutions post it...

Grok AI Predicts Hyperliquid to Surge 20x by 2027
Elon Musk’s Grok AI predicts that Hyperliquid (HYPE) could reach $1,500 by January 1, 2027, assuming a full-blown crypto bull mark...

Ethereum NFT Marketplace Blur to Shutter After Trading Volume Vanishes
Once the largest Ethereum NFT marketplace around, Blur said this week that it will shut off its frontend in November, concluding i...