Pi Coin Price Analysis: Can It Sustain Momentum?
At the time of writing the Pi coin price is $1.57 – only 8% down on its launch price. After initially surging to $1.97 upon the launch of its mainnet, Pi experienced a sharp decline of over 60%, bottoming out at $0.73. H...
Archive context
Older archive item. Useful for background and entity history, but not a fresh market-moving signal.
At the time of writing the Pi coin price is $1.57 – only 8% down on its launch price. After initially surging to $1.97 upon the launch of its mainnet, Pi experienced a sharp decline of over 60%, bottoming out at $0.73. However, it has since quickly rebounded reflecting short-term ‘buy the dip’ pressure. Since
Key Factors Driving Pi Coin’s Volatility- Massive Sell-offs – Early adopters cashed out large holdings immediately after trading began. This is typical of most presale exchange launches where early buyers want to maximise gains.
- Market Correction – Broader crypto market weakness contributed to the decline, with Bitcoin down 7% in the last week.
- Skepticism – Doubts about Pi Network’s legitimacy, including criticism from Bybit’s CEO, weighed on investor confidence.
Despite this volatility, Pi Network’s ecosystem continues to expand, boasting over 60 million users and multiple exchange listings on OKX, Bitget, and BitMart. Incentives like Bitget’s $60,000 Pi Coin airdrop and BitMart’s $3,000 giveaway are further driving engagement.
Technical Outlook Watch – Pi Network Price Prediction Video
Recent Performance and Indicators
- Price Movement: Over the past week, PI has experienced an 80.90% increase, indicating significant upward momentum.
- Technical Indicators:
- Relative Strength Index (RSI): Currently at 81.71, suggesting overbought conditions.
- Moving Averages: Short-term EMAs (10, 20, 30-day) are trending above the current price, indicating potential support levels.
- Immediate Support: Identified at $1.40; a decline below this could target the $1.35 to $1.30 range again.
- Resistance Levels: Near-term resistance was at $1.50, however, Pi has passed through that twice in the last 24 hours and maintaining current momentum could propel PI towards the $2.00 mark in the short term.
While Pi Coin exhibits bullish tendencies, traders should exercise caution due to overbought indicators and overall market volatility. Monitoring key support and resistance levels, along with staying informed on market developments, is essential for making informed trading decisions.
Recent Performance and Indicators
Price Movement: Over the past week, PI has experienced an 80.90% increase, indicating significant upward momentum. At the same time, despite the volatility market sentiment is strongly postivie on the Pi token’s potential – with 90% of voters on CoinMarketCap bullish on its prospects.
Technical Indicators
Relative Strength Index (RSI): Currently at 81.71, suggesting overbought conditions.
Moving Averages: Short-term EMAs (10, 20, 30-day) are trending above the current price, indicating potential support levels.
Support and Resistance Levels
Immediate Support: Identified at $1.40; a decline below this could target the $1.35 to $1.30 range again.
Resistance Levels: Near-term resistance was at $1.50, however, Pi has passed through that twice in the last 24 hours and maintaining current momentum could propel PI towards the $2.00 mark in the short term.
While Pi Coin exhibits bullish tendencies, traders should exercise caution due to overbought indicators and overall market volatility. Monitoring key support and resistance levels, along with staying informed on market developments, is essential for making informed trading decisions.
Why this matters
This research story adds another data point to the current market tape and is useful when read alongside nearby source coverage.
Original source
Read on Brave New CoinRelated market context

Bitcoin’s Volatility Has Fallen Within S&P 500 Ranks, Study Shows
Bitcoin Magazine Bitcoin’s Volatility Has Fallen Within S&P 500 Ranks, Study Shows Stocks and shares are a safer bet than buying b...

Bitcoin Price Prediction: Can BTC Rebound After a Brutal Sell-off?
Bitcoin is trading at $81,100, down 2.5% over 24 hours. The larger move has been rougher as it briefly slid toward $80,000 as soon...

Bitcoin ETF Records $260 Million Outflows, Led by Fidelity and BlackRock
US spot Bitcoin ETFs recorded $261.4 million in net outflows on October 14, led by Fidelity’s FBTC with $152.7 million withdrawn a...

Most net-long XRP positions sit above the current price, leaving traders underwater
High long exposure and potential liquidations could exacerbate XRP's price volatility, impacting market stability and trader confi...

Grayscale Research says 57% of S&P 500 companies are more volatile than Bitcoin
Bitcoin's reduced volatility compared to many S&P 500 companies suggests it may be a viable option for diversified investment port...
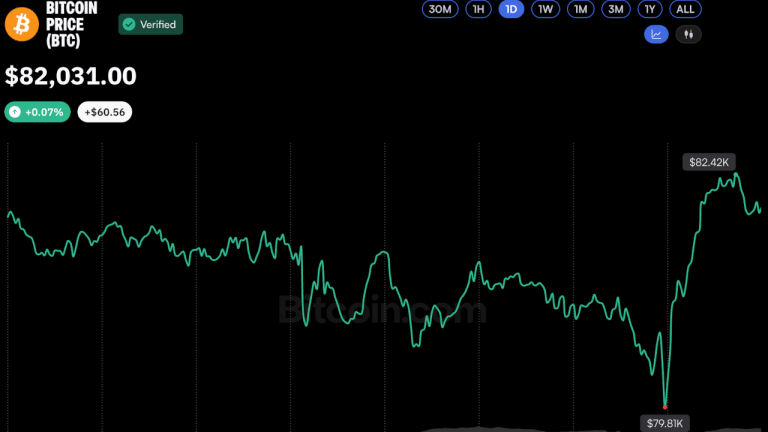
Bitcoin Price Rebounds Above $82K After Brief Dip Below $80K
Bitcoin staged a rapid recovery Thursday, climbing back above $82,000 to trade slightly higher over 24 hours with a market cap nea...