Uniswap Price Forecast: Breakout Above Trendline Sparks Bullish Target Toward $19
Recent movements have shifted the asset from a consolidation zone into a potential bullish continuation setup. Trading volumes, moving averages, and momentum indicators are now closely watched for confirmation. At the ti...
Archive context
Older archive item. Useful for background and entity history, but not a fresh market-moving signal.

Recent movements have shifted the asset from a consolidation zone into a potential bullish continuation setup.
Trading volumes, moving averages, and momentum indicators are now closely watched for confirmation. At the time of writing, the MACD signal is weakening, while UNI trades around $10.13 with signs of near-term hesitation.
Trendline Breakout Shifts UNI SentimentThe daily chart shared by analyst Crypto Hashmi displays a breakout from a multi-month descending trendline. This technical move is significant as it suggests the end of a prolonged downtrend, marked by a strong close above $9.50.
The asset now trades above the 20-day and 50-day EMAs, which have flipped to support zones. The trendline breakout aligns with increased volume, indicating participation from market buyers and not just algorithmic trading behavior.
Source: X
The analyst chart outlines potential upside targets at $11, $13, and $14, reflecting prior resistance levels. The risk-to-reward ratio appears favorable based on the marked stop-loss below the trendline.
This structure may encourage more technical participants to take long positions. However, the $10.50–$11.00 range remains a critical near-term resistance zone. A strong close above it would provide further confirmation of a bullish continuation.
24-Hour Chart Shows Intraday Volatility and Flat VolumeBetween July 30 and July 31, UNI experienced notable intraday volatility. The price began near $10.30 but quickly fell below $9.90, showing strong sell-side activity early in the session. Although there was a rebound later in the day, the price failed to retest previous highs, forming a lower high around $10.20. This movement signals cautious behavior from both buyers and sellers, especially after recent gains.
Source: BraveNewCoin
Volume during the session totaled approximately $601.65 million, remaining steady throughout the 24 hours. Despite the consistent trading activity, the lack of strong price movement implies a distribution phase.
Traders may be locking in profits after the breakout, or positioning for the next move. If the price maintains support above $9.90, it could build a base for further gains. A breakdown below this level could lead to a retest of $9.50 or $9.20 in the near term.
MACD and RSI Indicate Short-Term Consolidation RisksAt the time of writing, technical momentum indicators are showing early signs of cooling. The MACD line (0.614) is now below the signal line (0.723), and the histogram has turned slightly negative at -0.109. This crossover often precedes a consolidation or pullback phase, especially after strong rallies. Traders may watch this divergence closely for confirmation of weakening momentum before entering new positions.
Source: TradingView
The RSI reading stands at 57.78, above the neutral 50 threshold but down from earlier highs. This suggests that buying pressure remains present but is diminishing. The RSI continues to trend downward, raising the possibility of a near-term loss of strength. If the RSI dips below 50, it may signal further retracement.
Maintaining RSI above 50 and price support around $10.00 would be crucial for sustaining bullish potential. A breakout above $11.71 could set the stage for a longer-term rally toward the analyst’s projected target of $19.
Why this matters
This research story adds another data point to the current market tape and is useful when read alongside nearby source coverage.
Original source
Read on Brave New CoinRelated market context

SUI Crypto Up +2% Following $30M DATA Network Investment
SUI crypto trades at $1.12, up +2.2% over 24 hours, as traders weigh a sharp recent rebound against overhead resistance. The Sui F...

Bitcoin falls below $82,000 as $120 million in crypto longs get liquidated
The rapid liquidation highlights the volatility and risks of leveraged trading, potentially deterring cautious investors and impac...

Bitcoin records first bullish 13/34-week EMA crossover in 3.5 years
The bullish EMA crossover suggests potential upward momentum for Bitcoin, but macroeconomic factors like ETF flows and inflation r...

Bitcoin’s rebound approaches the $85,000 zone where past buyers may sell
Bitcoin and Ethereum extended their weekend recovery, although on-chain indicators and derivatives positioning suggest the rebound...

Bullish plugs its Bitcoin options into Elwood Technologies for post-trade management
The integration enhances institutional efficiency and market visibility, potentially driving broader adoption of Bitcoin options t...
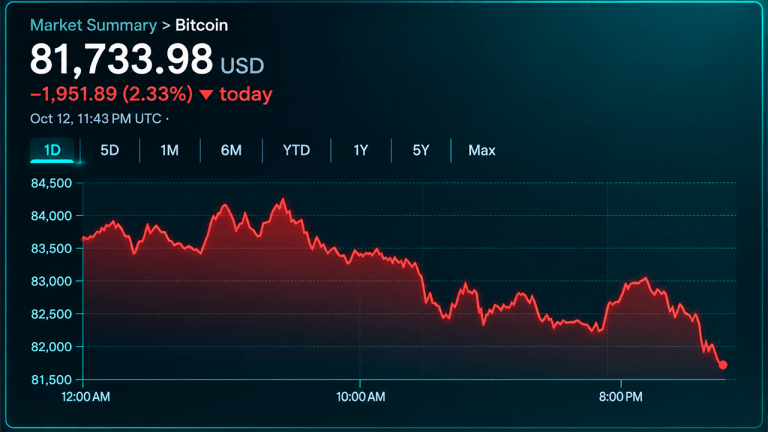
Bitcoin Price Falls Below $82K as $406M in Longs Get Liquidated
Bitcoin cracked below $82,000 Monday evening, setting off another painful reckoning for leveraged crypto traders. Nearly $489 mill...