BNB Price Corrects Gains After Strong Rally – Is It Just a Healthy Pullback?
BNB price is correcting gains from the $860 zone. The price is now facing hurdles near $820 and might dip again toward the $788 support. BNB price is correcting gains and traded below the $820 support zone. The price is...
Archive context
Older archive item. Useful for background and entity history, but not a fresh market-moving signal.

BNB price is correcting gains from the $860 zone. The price is now facing hurdles near $820 and might dip again toward the $788 support.
- BNB price is correcting gains and traded below the $820 support zone.
- The price is now trading below $810 and the 100-hourly simple moving average.
- There is a key bullish trend line forming with support at $800 on the hourly chart of the BNB/USD pair (data source from Binance).
- The pair must stay above the $788 level to start another increase in the near term.
After a steady increase, BNB price failed to clear the $860 zone. There was a downside correction below the $850 and $680 levels, like Ethereum and Bitcoin.
The price even dipped below $840 and tested $800. There was a clear move below the 23.6% Fib retracement level of the upward move from the $744 swing low to the $861 high. The bulls are now active near the $800 support zone.
There is also a key bullish trend line forming with support at $800 on the hourly chart of the BNB/USD pair. The price is now trading below $810 and the 100-hourly simple moving average.
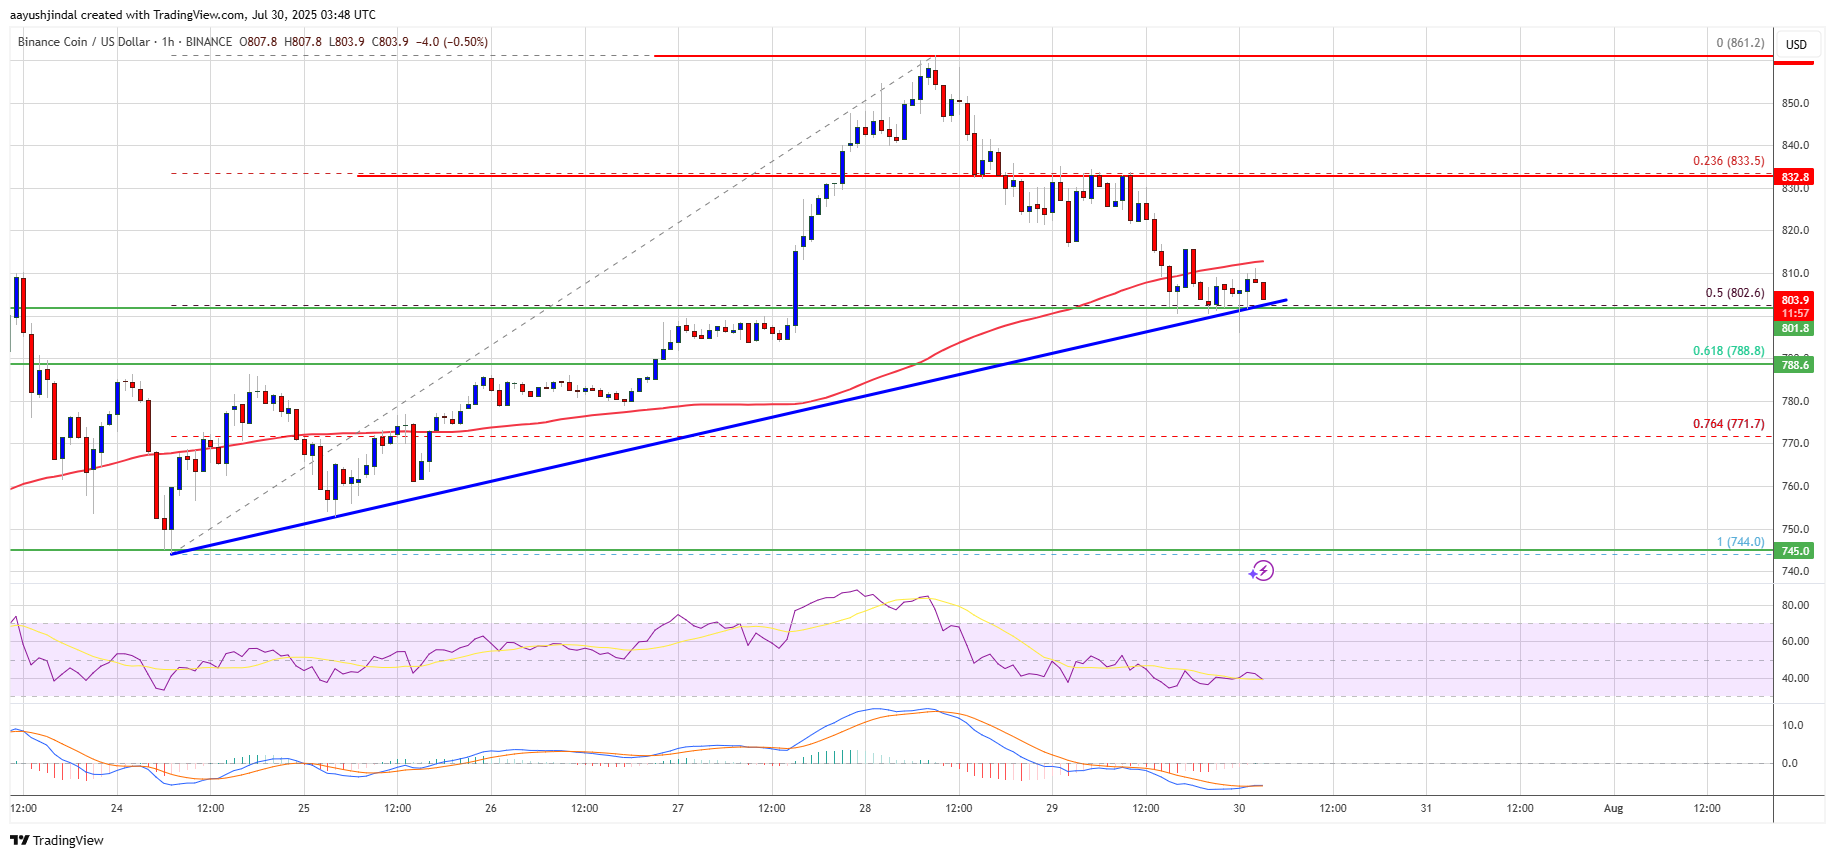
On the upside, the price could face resistance near the $810 level. The next resistance sits near the $820 level. A clear move above the $820 zone could send the price higher. In the stated case, BNB price could test $845. A close above the $845 resistance might set the pace for a larger move toward the $860 resistance. Any more gains might call for a test of the $880 level in the near term.
More Losses?If BNB fails to clear the $820 resistance, it could start another decline. Initial support on the downside is near the $800 level. The next major support is near the $788 level.
The main support sits at $770. If there is a downside break below the $770 support, the price could drop toward the $750 support. Any more losses could initiate a larger decline toward the $735 level.
Technical Indicators
Hourly MACD – The MACD for BNB/USD is gaining pace in the bearish zone.
Hourly RSI (Relative Strength Index) – The RSI for BNB/USD is currently below the 50 level.
Major Support Levels – $800 and $788.
Major Resistance Levels – $810 and $820.
Why this matters
This altcoin story adds another data point to the current market tape and is useful when read alongside nearby source coverage.
Original source
Read on NewsBTCRelated market context

Ethereum (ETH) Price Prediction: ETH Holds Near $2,500 as ETF Flows Turn Positive and Long Positions Reach Four-Year High
Ethereum is holding close to $2,500 after a volatile start to October, with the market now showing a mixture of improving institut...

Ethereum Price Prediction: Tom Lee Warns of ETH Drawdown After Kospi Bloodbath
Ethereum is trading at the $2,500 level as Tom Lee warns that Korea’s equity rout could spill into crypto, a bearish price predict...

Bitcoin (BTC) Price Prediction: Slowing Whale Selling Offers Hope as $81.5K ETF Support Holds
On-chain data indicates that distribution from longer-term holders has slowed, offering some relief to the market. However, weaken...

Binance News: Miners Must Move Before Pool Closes on November 10
In Binance news today, the exchange will shut down Binance Pool and related services at 07:00 UTC on November 10, 2026, ending its...

Sam Altman ChatGPT AI Predicts that BTC Could Hit $1.8M by 2027
Sam Altman OpenAI ChatGPT AI predicts that Bitcoin could reach $1.8M by January 1, 2027. This over-the-top bullish prediction clai...

XRP Price Faces Test Despite Improving Social Mood
XRP recorded 0.92 bullish comments for every bearish comment in Santiment’s October 13 reading, even as the token price fell more...