Solana (SOL) Extends Sell-Off to $130 as Recovery Attempts Remain Fragile
Solana started a fresh decline below the $145 zone. SOL price is now consolidating losses below $140 and might decline further below $130. SOL price started a fresh decline below $145 and $140 against the US Dollar. The...
Archive context
Older archive item. Useful for background and entity history, but not a fresh market-moving signal.

Solana started a fresh decline below the $145 zone. SOL price is now consolidating losses below $140 and might decline further below $130.
- SOL price started a fresh decline below $145 and $140 against the US Dollar.
- The price is now trading below $140 and the 100-hourly simple moving average.
- There is a key bearish trend line forming with resistance at $136 on the hourly chart of the SOL/USD pair (data source from Kraken).
- The price could start a recovery wave if the bulls defend $130 or $128.
Solana price failed to remain stable above $155 and started a fresh decline, like Bitcoin and Ethereum. SOL declined below the $150 and $140 support levels.
The price gained bearish momentum below $138. A low was formed at $128, and the price is now consolidating losses. The price recovered a few points above the 23.6% Fib retracement level of the downward move from the $143 swing high to the $128 low.
Solana is now trading below $140 and the 100-hourly simple moving average. On the upside, immediate resistance is near the $136 level. There is also a key bearish trend line forming with resistance at $136 on the hourly chart of the SOL/USD pair.
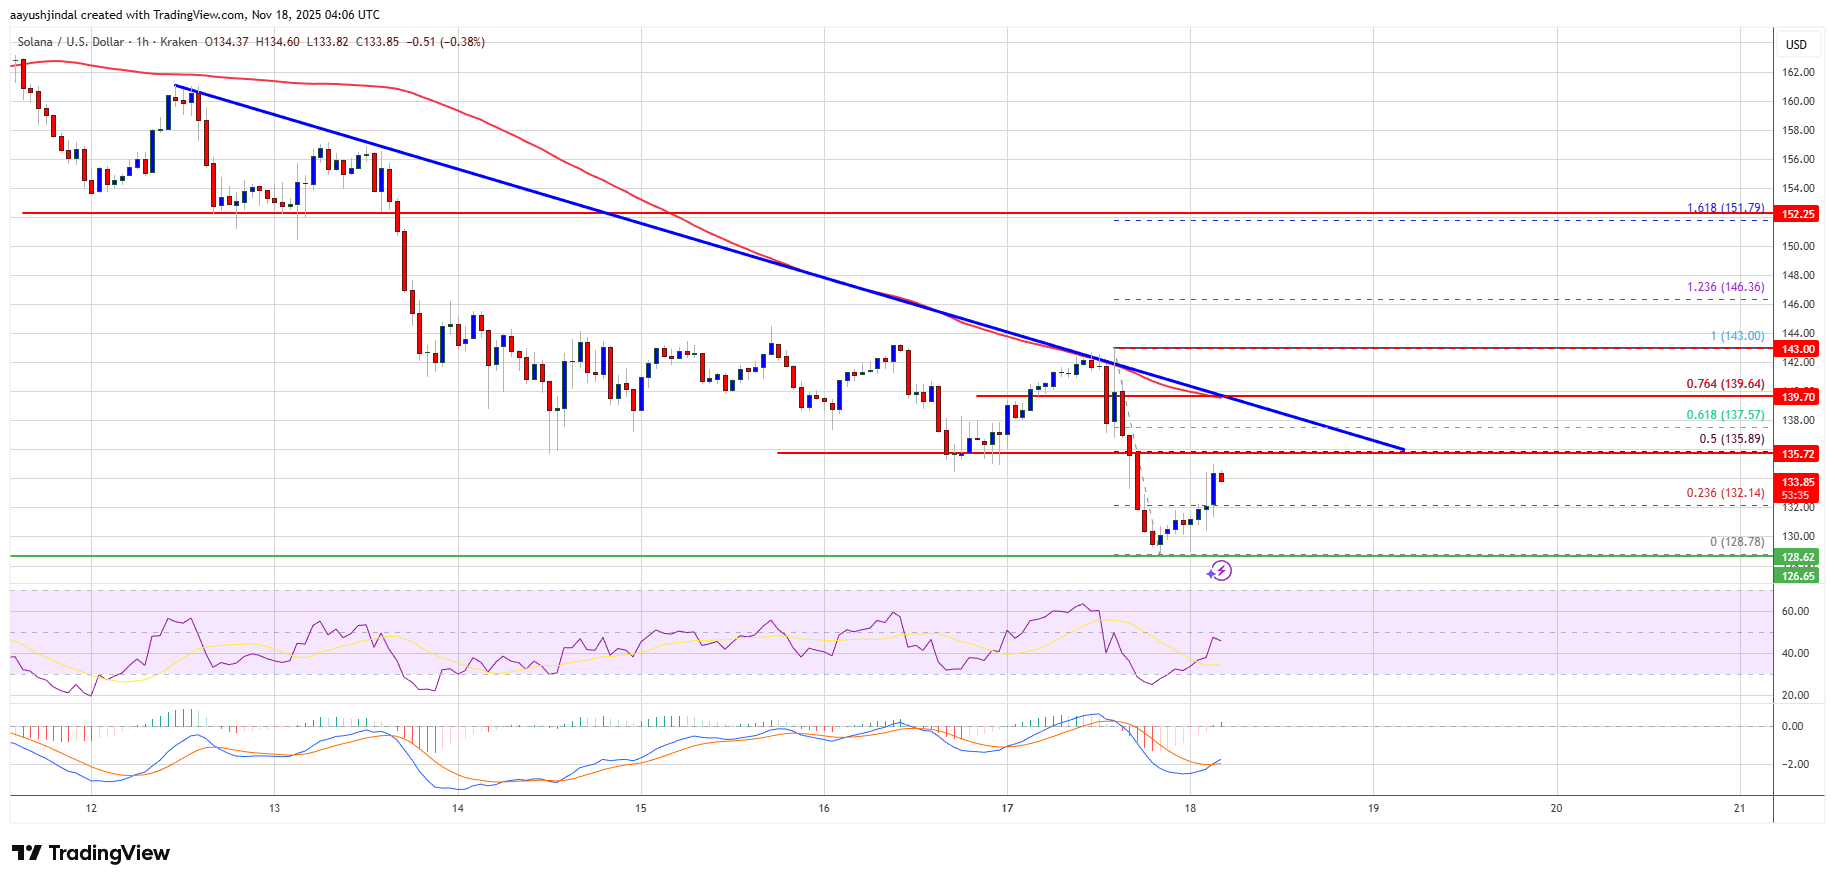
The next major resistance is near the $140 level or the 76.4% Fib retracement level of the downward move from the $143 swing high to the $128 low. The main resistance could be $142. A successful close above the $142 resistance zone could set the pace for another steady increase. The next key resistance is $150. Any more gains might send the price toward the $155 level.
Another Decline In SOL?If SOL fails to rise above the $140 resistance, it could continue to move down. Initial support on the downside is near the $130 zone. The first major support is near the $128 level.
A break below the $128 level might send the price toward the $120 support zone. If there is a close below the $120 support, the price could decline toward the $108 support in the near term.
Technical Indicators
Hourly MACD – The MACD for SOL/USD is gaining pace in the bearish zone.
Hourly Hours RSI (Relative Strength Index) – The RSI for SOL/USD is below the 50 level.
Major Support Levels – $130 and $128.
Major Resistance Levels – $136 and $140.
Why this matters
This altcoin story adds another data point to the current market tape and is useful when read alongside nearby source coverage.
Original source
Read on NewsBTCRelated market context

XRP Price Prediction: Elliott Wave Setup Points to $3 as XRP Nears a Potential $2 Breakout
XRP Price Prediction: Elliott Wave Setup Points to $3 as XRP Nears a Potential $2 Breakout XRP is approaching a critical technical...

Samsung Wallet Brings USDC to 82M Galaxy Devices With Coinbase, Solana and Sui Support
Key Takeaways: Samsung Wallet will support 82 million U.S. Galaxy to add transfers on USDC. Coinbase will keep USDC in their Coinb...

Bitcoin’s weekend rebound faces an $80,400 test after nearly $730 million in ETF outflows
Bitcoin traded near $82,900 in PerpFinder’s Oct. 10, 09:36 UTC snapshot, with traders watching whether the weekend rebound brings...

Solana token holder net income holds above $400K for two weeks
Sustained net income growth for Solana token holders highlights the network's potential for profitability, yet underscores volatil...

Solana hits 1.88M unique active addresses, its highest level in 13 months
Solana's surge in active addresses highlights its growing utility for stablecoin transactions, despite ETF outflows, signaling eco...

Ethereum Price Prediction: Is Tom Lee’s $25K ETH Target Too Ambitious?
Tom Lee’s $10,000 Ethereum price prediction implies a 1000% move from ETH’s current price at around $2,500. BitMine’s accumulation...