Solana (SOL) Grinds Upward as Broader Market Stabilizes — Is a Breakout Brewing?
Solana started a decent upward move above the $165 zone. SOL price is now consolidating and faces hurdles near the $172 zone. SOL price started a decent upward move above $162 and $165 against the US Dollar. The price is...
Archive context
Older archive item. Useful for background and entity history, but not a fresh market-moving signal.

Solana started a decent upward move above the $165 zone. SOL price is now consolidating and faces hurdles near the $172 zone.
- SOL price started a decent upward move above $162 and $165 against the US Dollar.
- The price is now trading above $165 and the 100-hourly simple moving average.
- There is a rising channel forming with resistance at $175 on the hourly chart of the SOL/USD pair (data source from Kraken).
- The price could continue to move up if it clears $172 and $175.
Solana price remained stable and started a decent recovery wave above $155, like Bitcoin and Ethereum. SOL was able to climb above the $162 pivot level.
There was a move above the 50% Fib retracement level of the downward move from the $188 swing high to the $145 low. However, the bears are now active near the $172 resistance zone. There is also a rising channel forming with resistance at $175 on the hourly chart of the SOL/USD pair.
Solana is now trading above $162 and the 100-hourly simple moving average. On the upside, immediate resistance is near the $172 level and the 61.8% Fib retracement level of the downward move from the $188 swing high to the $145 low.
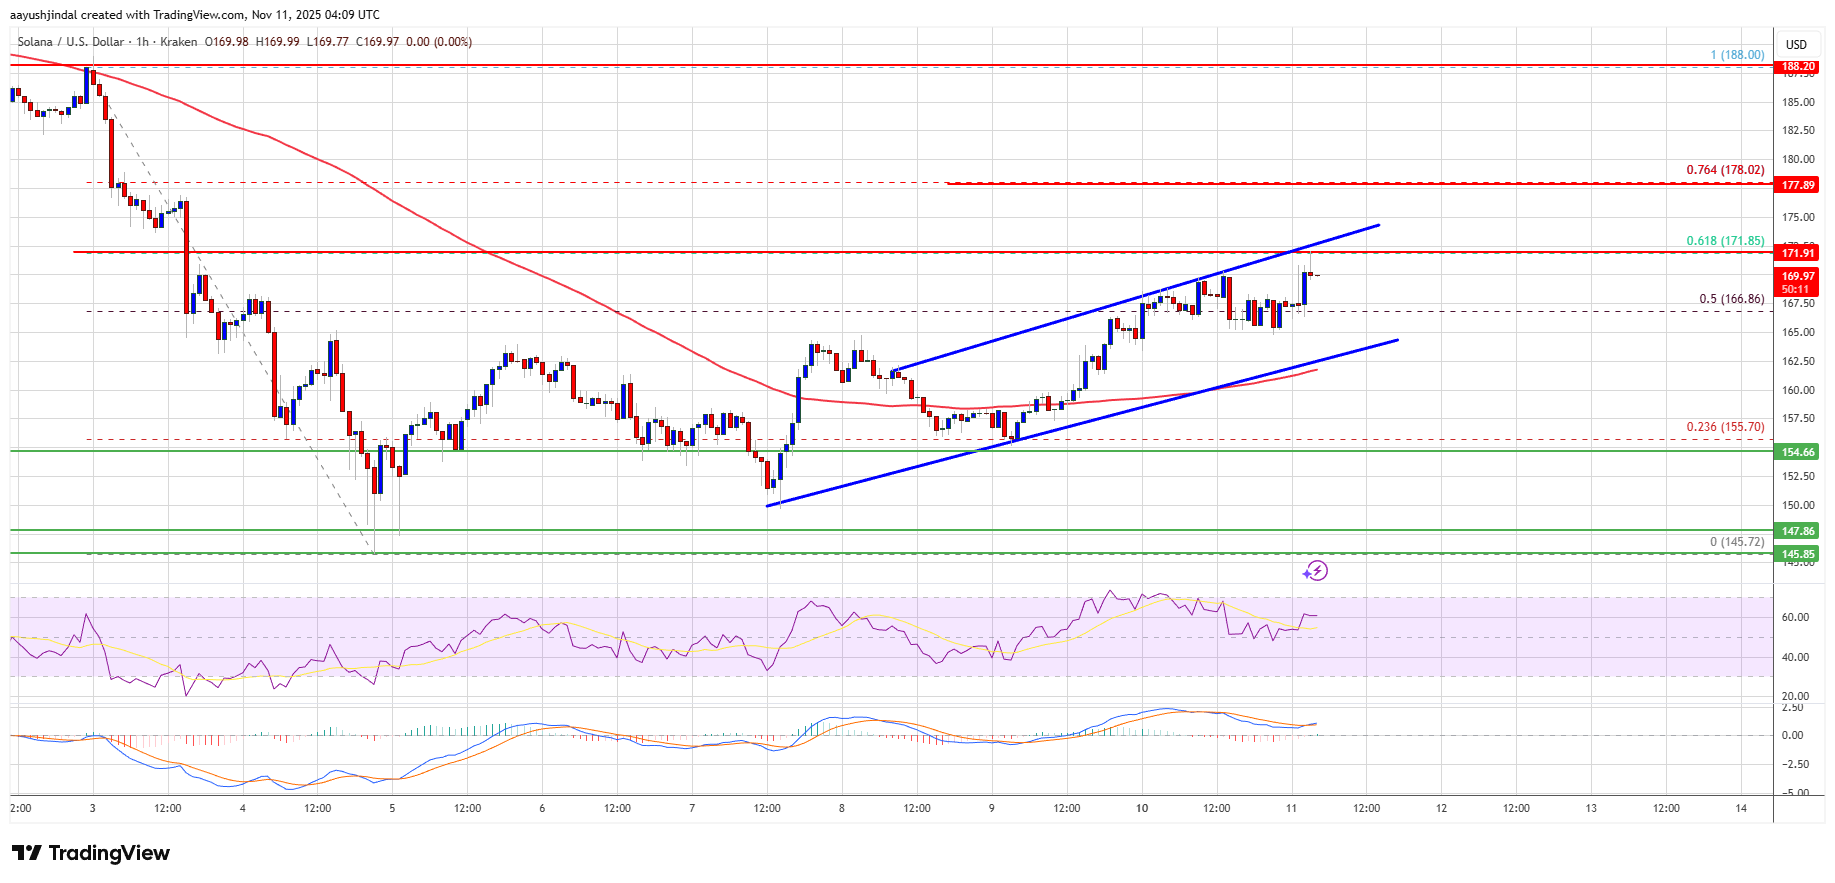
The next major resistance is near the $175 level. The main resistance could be $188. A successful close above the $188 resistance zone could set the pace for another steady increase. The next key resistance is $202. Any more gains might send the price toward the $220 level.
Another Decline In SOL?If SOL fails to rise above the $172 resistance, it could continue to move down. Initial support on the downside is near the $165 zone. The first major support is near the $162 level.
A break below the $162 level might send the price toward the $155 support zone. If there is a close below the $155 support, the price could decline toward the $150 zone in the near term.
Technical Indicators
Hourly MACD – The MACD for SOL/USD is gaining pace in the bullish zone.
Hourly Hours RSI (Relative Strength Index) – The RSI for SOL/USD is above the 50 level.
Major Support Levels – $165 and $162.
Major Resistance Levels – $172 and $175.
Why this matters
This altcoin story adds another data point to the current market tape and is useful when read alongside nearby source coverage.
Original source
Read on NewsBTCRelated market context

XRP Price Prediction: Elliott Wave Setup Points to $3 as XRP Nears a Potential $2 Breakout
XRP Price Prediction: Elliott Wave Setup Points to $3 as XRP Nears a Potential $2 Breakout XRP is approaching a critical technical...

Samsung Wallet Brings USDC to 82M Galaxy Devices With Coinbase, Solana and Sui Support
Key Takeaways: Samsung Wallet will support 82 million U.S. Galaxy to add transfers on USDC. Coinbase will keep USDC in their Coinb...

Meta AI Predicts This Huge Catalyst Could Lead to $40 XRP
Mark Zuckerberg’s Meta AI predicts an insanely wild bullish price target for XRP by January 1, 2027. The AI bot believes $25–$40 i...

Sam Altman ChatGPT AI Predicts Bitcoin to Hit Insane All-Time High in 2026
Sam Altman’s ChatGPT AI predicts Bitcoin could reach a new all-time high in 2026, nearly doubling its October 2025 high of $126,00...

XRP ETFs extend a 13-week inflow streak as Bitcoin, Ethereum and Solana funds shed $1.25 billion
US-listed XRP ETFs extended their inflow streak to 13 weeks as Bitcoin, Ethereum and Solana funds suffered nearly $1.25 billion in...

Ledger hack scare nears $90 million as Tether moves to freeze stolen USDT
Suspected Ledger wallet thefts are approaching $90 million as Tether freezes USDT stablecoin linked to the incident, according to...