XRP Price Could Rise If It Clears This Price Barrier
XRP Price has witnessed consolidation between the $0.30 and $0.37 mark for a considerable number of trading sessions. Over the last 24 hours, the altcoin has managed to hover around the same price mark without losing its...
Archive context
Older archive item. Useful for background and entity history, but not a fresh market-moving signal.

XRP Price has witnessed consolidation between the $0.30 and $0.37 mark for a considerable number of trading sessions. Over the last 24 hours, the altcoin has managed to hover around the same price mark without losing its market value. In the past week, XRP price has lost 2% of its value.
Lateral trading had caused buying strength of the coin to be be affected. For the bulls to take charge, it is important for XRP to break past its sideways trading. XRP had formed higher highs and higher lows at the end of July. The bulls don’t seem to be able to push past the $0.37 mark.
This could be pointed towards the lack of demand for XRP. The $0.37 mark has been a propelling point for the altcoin’s price, however, the bulls could not hold on to the momentum even then. With Bitcoin receding on its chart, many altcoins have also followed the same sentiment on their respective charts. Demand and broader market strength remain crucial for XRP.
XRP Price Analysis: Four Hour Chart XRP was priced at $0.37 on the four hour chart | Source: XRPUSD on TradingViewThe altcoin at the time of writing was trading for $0.37. XRP had witnessed sharp resistance at the $0.39 price ceiling. Incase XRP price manages to topple over the $0.39 level, there could be a possibility for a rally. Additional resistance mark for the coin was at $0.40.
The local support for XRP rested at $0.34. A fall below the $0.34 level will cause XRP to trade at $0.31. Amount of XRP traded over the last session had increased as the sellers were dominating the price action.
Technical Analysis XRP registered fall in buying strength on the four hour chart | Source: XRPUSD on TradingViewA continued sideways trading with XRP price oscillating between $0.30 and $0.37 has pushed buyers out of the market slowly. The technical indicator for the coin displayed that.
The Relative Strength Index was below the zero-line because sellers were more compared to buyers in the market. It was a sign of bearishness.
XRP price was pictured below the 20-SMA line which again is a sign of the bears resurfacing as the sellers were driving the price momentum in the market.
XRP displayed sell signal on the four hour chart | Source: XRPUSD on TradingViewThe fall in buying strength gave rise to sell signal for the altcoin at the time of writing. The indication of the sell signal meant that the bearishness was still prevailing. The Moving Average Convergence Divergence tells the price momentum with possibility of reversals.
MACD witnessed bearish crossover and formed the red histograms which are related to the sell signal. Bollinger Bands indicate the price volatility, thereby, pointing towards chance of price fluctuation. The bands became broader which meant that XRP price could witness upcoming price volatility.
Featured image from UnSplash, chart from TradingView.comWhy this matters
This altcoin story adds another data point to the current market tape and is useful when read alongside nearby source coverage.
Original source
Read on NewsBTCRelated market context

XRP Price Prediction: Elliott Wave Setup Points to $3 as XRP Nears a Potential $2 Breakout
XRP Price Prediction: Elliott Wave Setup Points to $3 as XRP Nears a Potential $2 Breakout XRP is approaching a critical technical...

What Is Crypto Spot Trading?
For example, a token can be up 70% and still be a terrible trade if you have no idea when to take profits. Likewise, a 30% dip can...
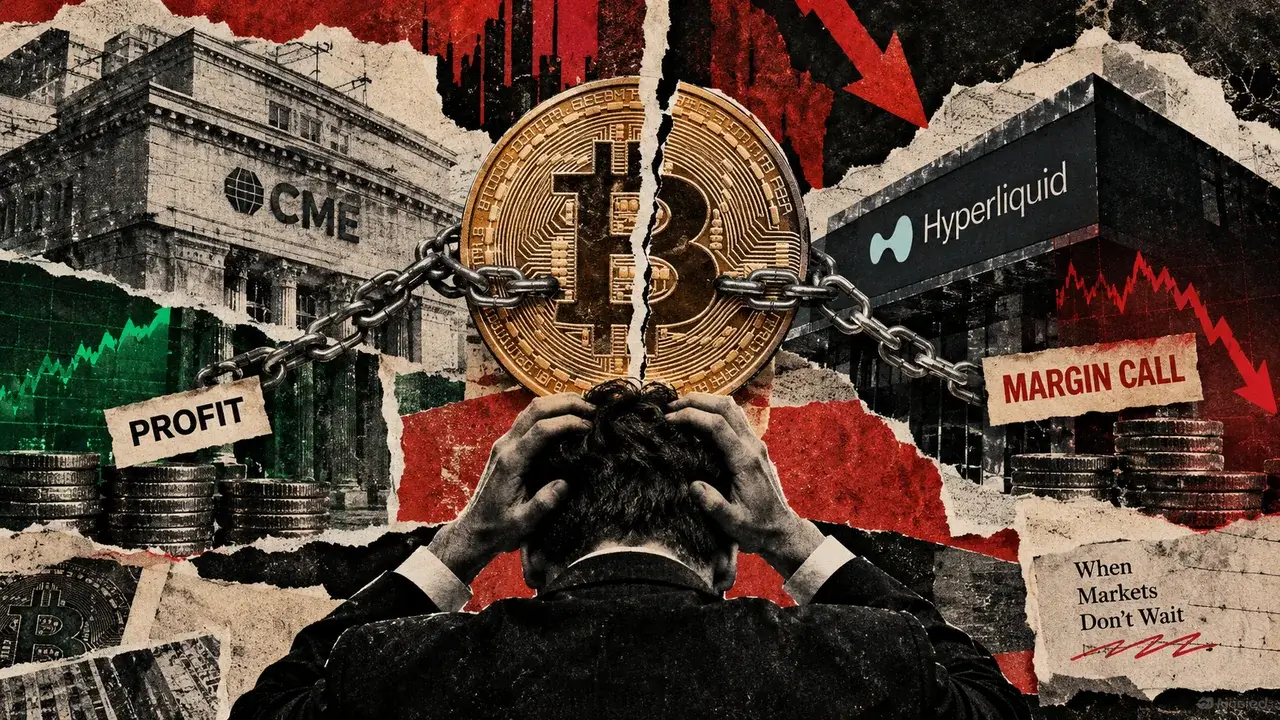
Bitcoin hedge funds face a liquidation trap when their collateral is split across markets
Here's a hypothetical situation: a hedge fund is making money, but one of its exchanges is about to liquidate its position anyway....
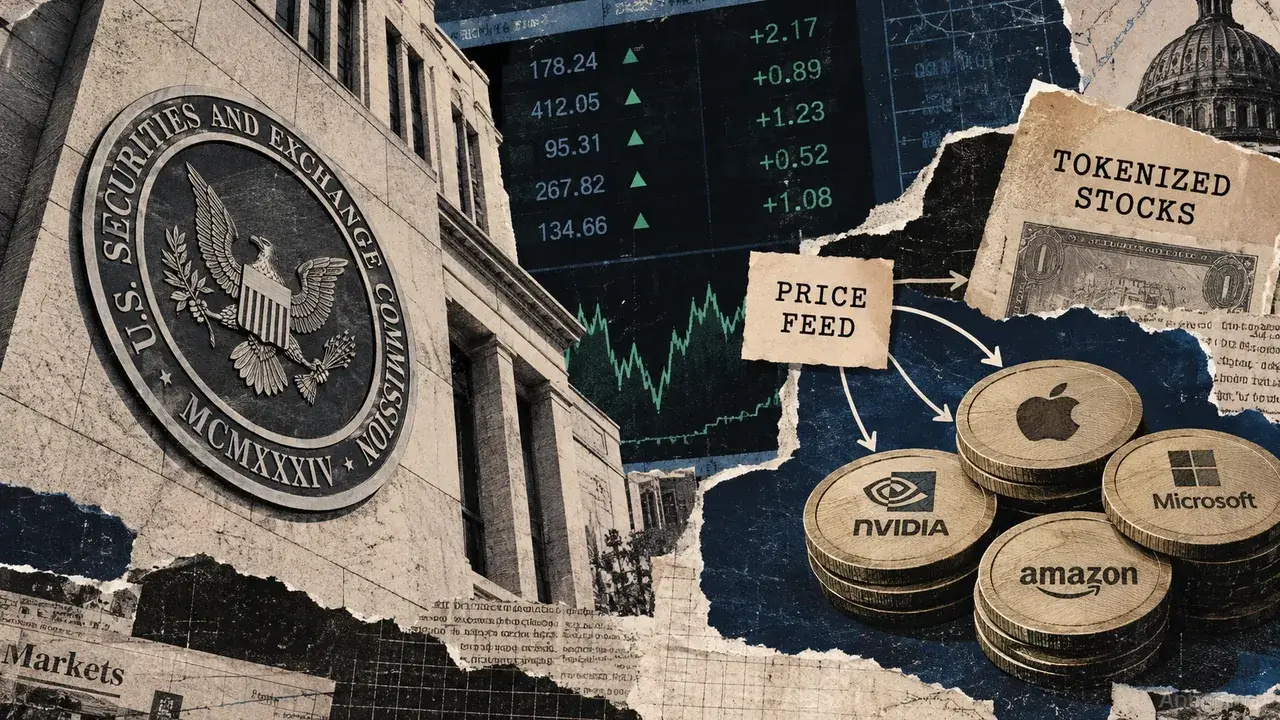
Tokenized stocks can carry the same rights without the same trading protections
Tokenized stocks eligible for the SEC’s September exemption must carry equivalent shareholder rights, yet their trading venues can...

Bitcoin Price Prediction: Can BTC USD Hold $82K Ahead of Next Week’s CPI Drop?
Bitcoin price prediction notes a brief recovery on Saturday, October 10, but the market remains poised for a weekly loss as rising...

Hong Kong brokers’ crypto trading commissions fall 13.5% in first half of 2026
The decline in crypto trading commissions may signal reduced investor confidence and liquidity, impacting market dynamics and regu...