Bitcoin Buy Signal: Why The 200-Week Moving Average Has Been A Flawless Entry Point
The 200-week moving average is one of the most critical macro indicators for Bitcoin, serving as the definitive divide between bear market capitulation and long-term accumulation. While BTC’s price movements are notoriou...
Archive context
Older archive item. Useful for background and entity history, but not a fresh market-moving signal.

The 200-week moving average is one of the most critical macro indicators for Bitcoin, serving as the definitive divide between bear market capitulation and long-term accumulation. While BTC’s price movements are notorious for their sudden, dramatic swings, history shows that the 200 WMA technical indicator has stood out with remarkable consistency.
How The 200 WMA Has Defined Every Bitcoin CycleLuke Broyles, an observer of Bitcoin’s market cycles, has noted on X that BTC has been screaming buy all 5 times that it hit the 200 WMA. This track record leads many to ask if they should hold a lump sum on the sidelines until that hits.
Broyles acknowledges that while BTC has been trending down, that hasn’t been the worst idea in the world. Although it isn’t a magic bullet. As Broyles explains, 3 out of the 5 times it has hit the 200 WMA, it was there for mere days. The worst part is that when BTC trends upward, the 200 WMA rises with it, making the ideal entry a constantly moving target.
However, Broyles provided a vivid example from recent history. In April 2023, BTC was $31,000, and the 200 WMA was $25,000. Before that, BTC was $16,000 months ago, and many thought a pullback into the $20,000 range was likely. Meanwhile, the analyst advocates for a buy at 31,000. During that time, 200 WMA was so close, and they cared more about bragging rights of I bought at the 200 WMA instead of simply accumulating BTC.
By the time BTC briefly dipped below the line again, it was already at $28,000, and that was the last chance. Currently, the 200 WMA sits comfortably above $50,000, and if BTC’s uptrend continues, that line could climb to $70,000 or even $100,000 before price ever revisits it.
Why Bitcoin Remains Bullish On Higher TimeframesAn analyst known as Scient has emphasized that BTC is on the higher timeframes. The blue zone remains a must-hold area for bullish continuation, with price consolidating above $108,000 for nearly three months. This range could be setting up a clean flip of that level into support before a major expansion phase.
Furthermore, all liquidity below the range lows (RLs) has been swept. The recent drop followed a higher high (HH) on the 3-day chart, and now BTC sits right at the RLs, an ideal zone where a higher low (HL) could confirm a continuation pattern.
Scient pointed out that it’s the candle body that matters for divergence, the wicks don’t count. He’s watching closely for hidden bullish divergences to develop on the 3D timeframe, which would confirm the bullish setup. According to the analyst, this week looks relatively slow, but the next volatile move will likely come next week.
Why this matters
This bitcoin story adds another data point to the current market tape and is useful when read alongside nearby source coverage.
Original source
Read on NewsBTCRelated market context
Bitcoin may be underpricing higher-for-longer Fed risk, Bitget Wallet analyst says
Bitcoin's potential underpricing of prolonged Fed risks could lead to market volatility, impacting investor strategies and stablec...

Bitcoin (BTC) Price Prediction: Slowing Whale Selling Offers Hope as $81.5K ETF Support Holds
On-chain data indicates that distribution from longer-term holders has slowed, offering some relief to the market. However, weaken...

XRP Price Faces a Turning Point as ETFs Record 13 Weeks of Inflows
XRP ETFs have already attracted $8 million in net inflows this week, extending their positive streak to 13 weeks, while Bitcoin, E...

Bitcoin Price Prediction: Can BTC Rebound After a Brutal Sell-off?
Bitcoin is trading at $81,100, down 2.5% over 24 hours. The larger move has been rougher as it briefly slid toward $80,000 as soon...

Sam Altman ChatGPT AI Predicts that BTC Could Hit $1.8M by 2027
Sam Altman OpenAI ChatGPT AI predicts that Bitcoin could reach $1.8M by January 1, 2027. This over-the-top bullish prediction clai...
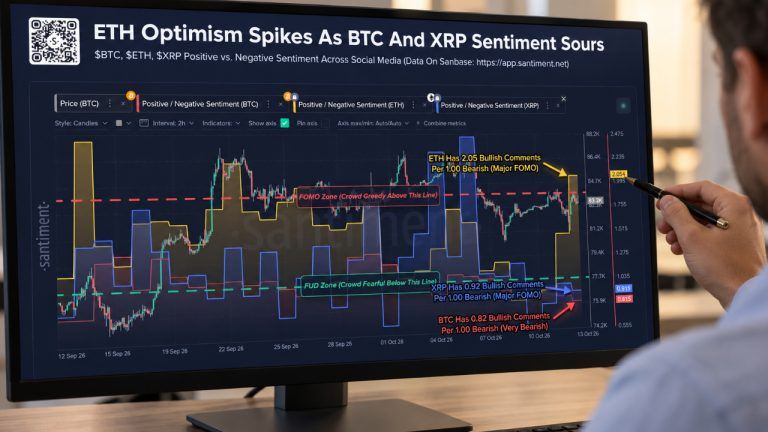
Bitcoin and XRP Sentiment Turn Fearful as Ethereum Draws Bullish Buzz
Bitcoin and XRP social sentiment is bearish after price declines, including XRP’s weekly drop exceeding 9%, while ether attracts r...