Bitcoin RSI Shows Shocking Similarities To 2012-2015, But What Happened Last Time?
A crypto analyst has revisited long-term charts from 2012-2015, noting that the current Bitcoin (BTC) cycle shows striking similarities to this timeline, in terms of the Relative Strength Index (RSI) and price action. Du...
Archive context
Older archive item. Useful for background and entity history, but not a fresh market-moving signal.

A crypto analyst has revisited long-term charts from 2012-2015, noting that the current Bitcoin (BTC) cycle shows striking similarities to this timeline, in terms of the Relative Strength Index (RSI) and price action. During the 2017-2015 bull run, BTC experienced one of the strongest multi-year advances before bottoming out. The market expert claims that the same sequence of peaks and pullbacks observed in that timeline is now unfolding again in this cycle.
Bitcoin RSI Comparison Signals Bottoming StructureBitcoin’s latest momentum study by crypto analyst Tony Severino has drawn significant attention from market watchers. In his X post on December 6, Severino highlighted surprising similarities between the RSI trend and price movements of the 2023-2026 cycle and those observed from 2012 to 2015.
His comparison focuses on the timing of several major points that appeared in both cycles. These include the moment a price bottom began to form, the first price peak, a subsequent momentum peak, and finally a Bearish Divergence that typically precedes deeper corrective phases.
Severino shared a chart from the 2012-2015 cycle showing that Bitcoin’s RSI had gradually climbed, with several short bursts of sharper upward momentum along the way. Eventually, momentum faded, and the indicator declined for an extended period before settling in a mid-range zone at the 44 level.
In the current cycle, which began in 2023, the RSI also climbed sharply before reaching a notable peak. Since then, the indicator has been gradually declining, currently sitting around 38. This level is similar to the mid-range RSI values observed in the former cycle before Bitcoin advanced again.
Sharing a second chart, Severino also pointed to Bitcoin’s price action relative to its RSI performance across both cycles. During the earlier cycle, Bitcoin’s price sat around $233.54, while in the recent cycle, it has declined to $89,352. The analyst argues that the alignment between the RSI movements and price action in both timelines strengthens his theory that Bitcoin may be approaching a meaningful bottom soon.
Severino also suggested that if history repeats in the 2023-2026 cycle, traders could be looking at the early stages of a year-long accumulation phase, similar to what played out a decade ago. Nevertheless, he acknowledged that there is no guarantee that the current cycle will mirror past patterns completely.
Analyst Flags New BTC Bullish CrossoverCrypto analyst AO has shared a more optimistic outlook for Bitcoin, highlighting the formation of a Bullish Crossover—a key technical signal that has historically preceded significant price surges. According to him, each time the Stochastic RSI on US10Y*CN10Y experiences a Bullish Crossover, Bitcoin enters a significant bull run.
AO presented a chart showcasing four previous Bullish Crossovers, each followed by a massive price increase. The first crossover appeared in 2013 and coincided with an early surge. The second came in 2017, marking the start of a multi-month bull run. The third occurred in late 2020, shortly before BTC’s record-breaking run in 2021. The most recent signal has not emerged in 2025, suggesting the potential for a similar upward move.
Why this matters
This bitcoin story adds another data point to the current market tape and is useful when read alongside nearby source coverage.
Original source
Read on NewsBTCRelated market context

Bitcoin (BTC) Price Prediction: Slowing Whale Selling Offers Hope as $81.5K ETF Support Holds
On-chain data indicates that distribution from longer-term holders has slowed, offering some relief to the market. However, weaken...

Bitcoin and XRP Sentiment Turn Fearful as Ethereum Draws Bullish Buzz
Bitcoin and XRP social sentiment is bearish after price declines, including XRP’s weekly drop exceeding 9%, while ether attracts r...

Matt Dines: Why a Rising Dollar is Bullish for Bitcoin
Bitcoin Magazine Matt Dines: Why a Rising Dollar is Bullish for Bitcoin The dollar is rising, and so is Bitcoin. Matt Dines says t...

Sam Altman ChatGPT AI Predicts that BTC Could Hit $1.8M by 2027
Sam Altman OpenAI ChatGPT AI predicts that Bitcoin could reach $1.8M by January 1, 2027. This over-the-top bullish prediction clai...

Ethereum (ETH) Price Prediction: ETH Holds Near $2,500 as ETF Flows Turn Positive and Long Positions Reach Four-Year High
Ethereum is holding close to $2,500 after a volatile start to October, with the market now showing a mixture of improving institut...
Bitcoin Price Slips as Saylor’s Bull Market Call Meets Reality
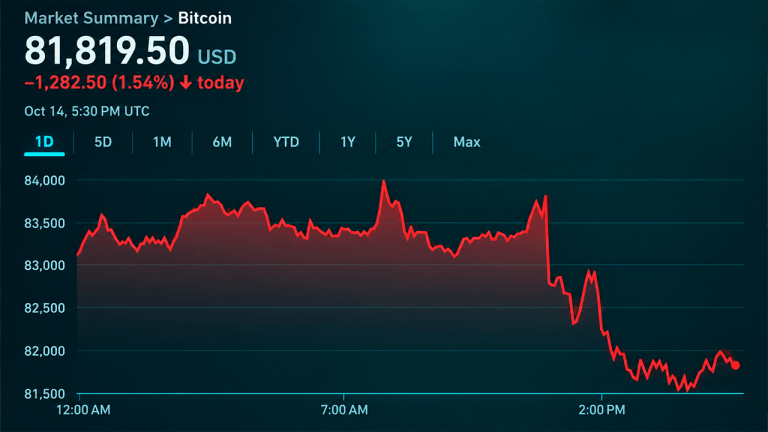
Bitcoin’s price tapped an intraday low of $81,500 per coin on Wednesday, Oct. 14, as hotter-than-expected U.S. inflation data ratt...