Down But Not Out: The One Line Bitcoin Must Hold To Be Bullish
Bitcoin price is falling, testing the low $26,000 area of support after weeks of painful, sideways consolidation. While the horizontal support line is clearly important, it’s nowhere near as critical as another line that...
Archive context
Older archive item. Useful for background and entity history, but not a fresh market-moving signal.

Bitcoin price is falling, testing the low $26,000 area of support after weeks of painful, sideways consolidation.
While the horizontal support line is clearly important, it’s nowhere near as critical as another line that BTCUSD absolutely must hold to remain bullish.
Drawing Trend Lines In Bitcoin Technical AnalysisIn the practice of technical analysis, drawing trend lines is among the first basic steps anyone will take. Simply connect the line across various points on the chart to highlight support and resistancesupport and resistance.
Another basic step involves turning on technical indicators to look for potential buy and sell signals. Some of these tools call out when an asset is overbought or oversold, such as the Relative Strength Index.
More advanced techniques include drawing trend lines on indicators like the RSI instead of price. Much like drawing these lines from point to point diagonally can plot uptrends or downtrends, horizontal lines can also act as support or resistance on the RSI.
On the weekly timeframe Bitcoin price has pulled back to a reading of 53 on the RSI. This level must hold, according to past price history. Each time it has, the crypto market has erupted higher.
Bulls Must Show “Strength” At Current LevelsThe above BTCUSD weekly chart shows the RSI pulling back to a reading of 53. The last time this happened, was in Q3 2020 right before an epic bull run. The short bullish rally in 2019 blasted right through it without a retest of the level.
Prior to these instances, all other outcomes were shockingly bullish when Bitcoin held above the line. Rather than falling into a bearish phase, each time BTCUSD weekly RSI held at the line in 2016 and 2017, the crypto market simply marched higher.
Other times, when BTCUSD failed to hold this line, a bear market ensued. A failed attempt to get back above the level typically led to the last leg of the bear market. However, getting back above it and then failing to hold could provide the crypto market with something more reminiscent of the COVID collapse and is something to watch closely for. Hold the line, and bulls will run again, possibly to new all-time highs.
https://twitter.com/tonythebullBTC/status/1661464701853745152
Why this matters
This bitcoin story adds another data point to the current market tape and is useful when read alongside nearby source coverage.
Original source
Read on NewsBTCRelated market context

Ethereum (ETH) Price Prediction: Whale Longs Surge as $2,200 Demand Zone Puts $3,000 Back in Focus
Ethereum is attempting to stabilize after another difficult stretch, with price returning to an area that has repeatedly played an...
Bitcoin Price Holds 50-Week Trend Despite $6.3B Binance Hack
Bitcoin has closed above its 50-week moving average for a seventh consecutive week despite the $6.3 billion Binance hack and renew...

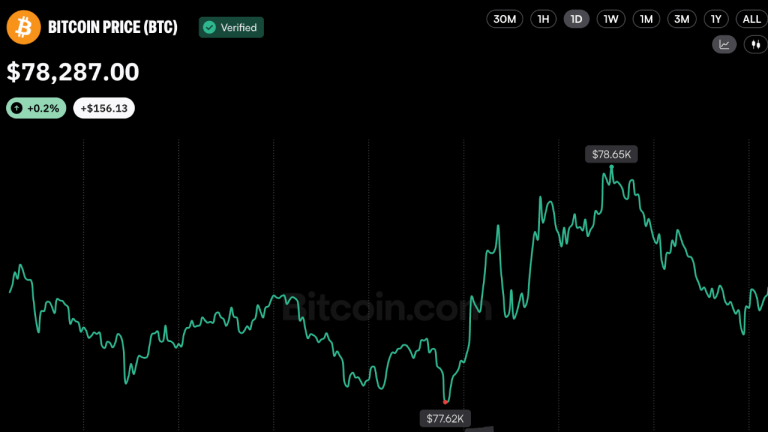
Bitcoin holds above $77K ahead of US midterm elections
Bitcoin's resilience amid a dense economic calendar could bolster market confidence, but breaking key support may signal increased...

Microsoft Bearish On Ripple? Copilot AI Predicts a Huge XRP Crash Looms
Is Microsoft bearish on Ripple? Its AI bot, Copilot AI, predicts that something potentially severe could be approaching for XRP by...

Noble USDC Holders Face New Migration Phase as CCTP Limits Start Winding Down
TL;DR: Circle’s published schedule begins reducing legacy CCTP burn limits from October 31. Noble has a separate January 2027 paus...

Elon Musk’s Grok AI Predicts Lighter Crypto to Flip Hyperliquid
Elon Musk’s AI bot has made an insanely controversial call. Grok AI predicts a potentially significant development for Lighter by...