WATCH: Bitcoin Brutalized After August CPI Data Release | BTCUSD September 13, 2022
In this episode of NewsBTC’s daily technical analysis videos, we take a look at Bitcoin price action following today’s selloff in reaction to August CPI numbers. Take a look at the video below: VIDEO: Bitcoin Price Analy...
Archive context
Older archive item. Useful for background and entity history, but not a fresh market-moving signal.

In this episode of NewsBTC’s daily technical analysis videos, we take a look at Bitcoin price action following today’s selloff in reaction to August CPI numbers.
Take a look at the video below:
VIDEO: Bitcoin Price Analysis (BTCUSD): September 13, 2022Today just so happened to be August CPI numbers release day, so volatility was expected all around. The Consumer Price Index went up by 0.1% month over month from July, leading to an immediate selloff in anything that wasn’t the dollar.
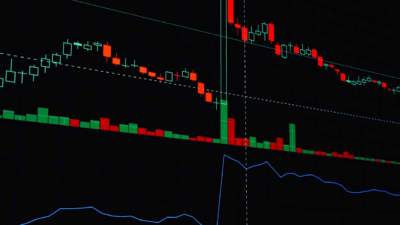
BTCUSD Buy Signals At Risk After CPI SelloffThe selloff really was immediate. When looking at the one-minute candle, Bitcoin lost over 6% in value in a minute or two. Sell orders executed within seconds of CPI numbers being released.
The selloff is notable as it is putting many of the buy signals from the weekly open in yesterday’s video at risk. These signals appeared at the open of the weekly session, which means a close this week was always required to confirm the signals.
Quite the dump the second CPI numbers were released | Source: BTCUSD on TradingView.com Bitcoin Bottom Fractal Features Similar Selloff Ahead Of BreakoutThe 2018 Bitcoin bear market bottom had a selloff that was very similar to today’s price action and resulting candlestick.
Using nothing more than an arrow placed at both of these key moments, when zoomed out on the weekly the selloffs both occurred just as these important buy signals were triggered on weekly timeframes.
The weekly buy signals are now at risk | Source: BTCUSD on TradingView.comRelated Reading: WATCH: Bitcoin Bottoms As Easy As Pi? | BTCUSD September 9, 2022
Could The Top Crypto Close The Year Back At $40K?The timing of the pullback today is eerily similar to the 2018 bear market bottom, according to a fractal placed below the current price action. In this instance, Bitcoin never made new lows, but instead simply moved sideways for several more weeks to draw in more short interest.
The cryptocurrency then rallied by more than 300% in three months. If the fractal continues to be followed, Bitcoin price could end the year at around $40,000 per coin.
Will BTC close above $40K to end the year? | Source: BTCUSD on TradingView.com More Downside Instead? What The Bearish Scenario Looks LikeOf course we’d be foolish to rule out more downside considering the bearish macro backdrop. Taking a fractal from the last correction, we could have a roadmap for the last leg down.
The fractal has Bitcoin price terminating the pattern only a few hundred dollars away from the 2019 peak and would complete an expanded flat pattern.
What another leg down could look like | Source: BTCUSD on TradingView.comLearn crypto technical analysis yourself with the NewsBTC Trading Course. Click here to access the free educational program.
Follow @TonySpilotroBTC on Twitter or join the TonyTradesBTC Telegram for exclusive daily market insights and technical analysis education. Please note: Content is educational and should not be considered investment advice.
Featured image from iStockPhoto, Charts from TradingView.com BTCUSD Buy Signals At Risk After CPI SelloffThe selloff really was immediate. When looking at the one-minute candle, Bitcoin lost over 6% in value in a minute or two. Sell orders executed within seconds of CPI numbers being released.
The selloff is notable as it is putting many of the buy signals from the weekly open in yesterday’s video at risk. These signals appeared at the open of the weekly session, which means a close this week was always required to confirm the signals.
Quite the dump the second CPI numbers were released | Source: BTCUSD on TradingView.com Bitcoin Bottom Fractal Features Similar Selloff Ahead Of BreakoutThe 2018 Bitcoin bear market bottom had a selloff that was very similar to today’s price action and resulting candlestick.
Using nothing more than an arrow placed at both of these key moments, when zoomed out on the weekly the selloffs both occurred just as these important buy signals were triggered on weekly timeframes.
The weekly buy signals are now at risk | Source: BTCUSD on TradingView.comRelated Reading: WATCH: Bitcoin Bottoms As Easy As Pi? | BTCUSD September 9, 2022
Could The Top Crypto Close The Year Back At $40K?The timing of the pullback today is eerily similar to the 2018 bear market bottom, according to a fractal placed below the current price action. In this instance, Bitcoin never made new lows, but instead simply moved sideways for several more weeks to draw in more short interest.
The cryptocurrency then rallied by more than 300% in three months. If the fractal continues to be followed, Bitcoin price could end the year at around $40,000 per coin.
Will BTC close above $40K to end the year? | Source: BTCUSD on TradingView.com More Downside Instead? What The Bearish Scenario Looks LikeOf course we’d be foolish to rule out more downside considering the bearish macro backdrop. Taking a fractal from the last correction, we could have a roadmap for the last leg down.
The fractal has Bitcoin price terminating the pattern only a few hundred dollars away from the 2019 peak and would complete an expanded flat pattern.
What another leg down could look like | Source: BTCUSD on TradingView.comLearn crypto technical analysis yourself with the NewsBTC Trading Course. Click here to access the free educational program.
Follow @TonySpilotroBTC on Twitter or join the TonyTradesBTC Telegram for exclusive daily market insights and technical analysis education. Please note: Content is educational and should not be considered investment advice.
Featured image from iStockPhoto, Charts from TradingView.comWhy this matters
This bitcoin story adds another data point to the current market tape and is useful when read alongside nearby source coverage.
Original source
Read on NewsBTCRelated market context

Bitcoin (BTC) Price Prediction: $73K Support at Risk as Benjamin Cowen Warns of NASDAQ Correction, Glassnode Shows Resilience
However, Glassnode data presents a more balanced picture, showing that spot trading activity remains above its August 2026 trough...

Aave’s Risk Manager Wants a Borrowing Speed Limit After Binance Hackers Took $44.6 Million
LlamaRisk, the risk manager for lending protocol Aave, is going to put a throttle on how much can be borrowed on Aave over certain...

Bitcoin Slides to a Seven-Week Low Near $75,200 as AI Stocks Drag Wall Street Lower
Bitcoin fell about 5.9% in the 24 hours to 3 a.m. ET Friday, sliding from about $80,360 to $75,620 on Binance as a selloff in arti...

Bitcoin tumbles below $77K as tech and crypto stocks plunge in broad market selloff
The rapid liquidation highlights the risks of high leverage in volatile markets, potentially triggering cascading sell-offs and ma...
Binance France to close all customer accounts by year end, with fees on idle balances from November 29
Binance France's closure highlights regulatory challenges in the crypto sector, urging users to act swiftly to avoid financial pen...

Bitcoin closer to being allowed in U.S. retirement accounts
The potential inclusion of Bitcoin in U.S. retirement accounts could drive broader cryptocurrency adoption and influence market dy...