DOT Price (Polkadot) Hints At Potential Recovery, Here’s What Could Propel It To $4.8
Polkadot’s DOT is recovering higher from the $3.92 support against the US Dollar. The price could gain pace if it clears the $4.20 and $4.35 resistance levels. DOT is slowly moving higher above the $4.05 resistance zone...
Archive context
Older archive item. Useful for background and entity history, but not a fresh market-moving signal.

Polkadot’s DOT is recovering higher from the $3.92 support against the US Dollar. The price could gain pace if it clears the $4.20 and $4.35 resistance levels.
- DOT is slowly moving higher above the $4.05 resistance zone against the US Dollar.
- The price is trading just above the $4.15 zone and the 100 simple moving average (4 hours).
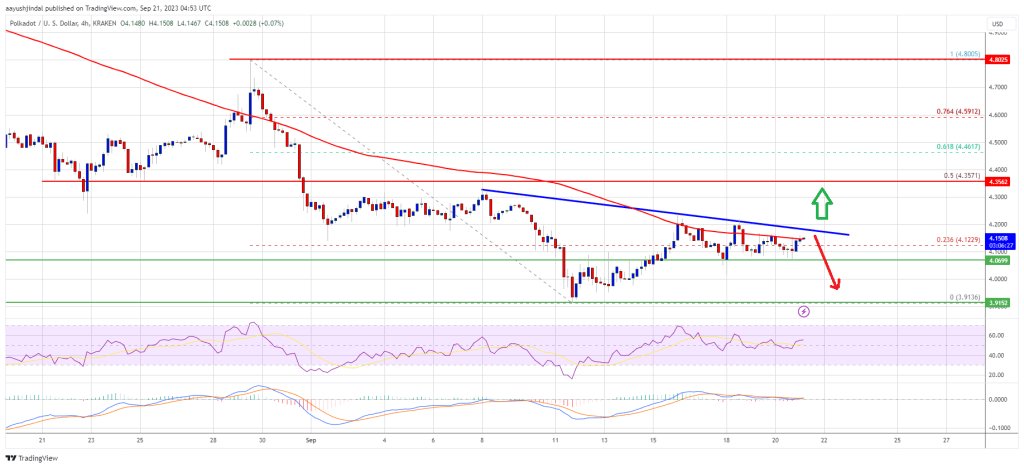
- There is a key bearish trend line forming with resistance near $4.175 on the 4-hour chart of the DOT/USD pair (data source from Kraken).
- The pair could gain bullish momentum if there is a close above $4.20 and $4.35.
After a sharp decline, DOT price found support near the $3.90 zone. A low is formed near $3.91 and the price is now attempting a fresh increase, like Bitcoin and Ethereum.
There was a break above the $4.00 and $4.05 resistance levels. The price surpassed the 23.6% Fib retracement level of the downward move from the $4.80 swing high to the $3.91 low. DOT is now trading just above the $4.15 zone and the 100 simple moving average (4 hours).
Immediate resistance is near the $4.20 level. There is also a key bearish trend line forming with resistance near $4.175 on the 4-hour chart of the DOT/USD pair.
Source: DOTUSD on TradingView.com
The next major resistance is near $4.35. It is near the 50% Fib retracement level of the downward move from the $4.80 swing high to the $3.91 low. A successful break above $4.35 could start a strong rally. In the stated case, the price could easily rally toward $4.80 in the coming days. The next major resistance is seen near the $5.0 zone.
Another Decline?If DOT price fails to continue higher above $4.20 or $4.35, it could start another decline. The first key support is near the $4.05 level.
The next major support is near the $3.90 level and the last low, below which the price might decline to $3.75. Any more losses may perhaps open the doors for a move toward the $3.50 support zone.
Technical Indicators
4-Hours MACD – The MACD for DOT/USD is now gaining momentum in the bullish zone.
4-Hours RSI (Relative Strength Index) – The RSI for DOT/USD is now above the 50 level.
Major Support Levels – $4.05, $3.90 and $3.75.
Major Resistance Levels – $4.20, $4.35, and $4.80.
Why this matters
This cryptocurrency story adds another data point to the current market tape and is useful when read alongside nearby source coverage.
Original source
Read on NewsBTCRelated market context

Ethereum (ETH) Price Prediction: Whale Longs Surge as $2,200 Demand Zone Puts $3,000 Back in Focus
Ethereum is attempting to stabilize after another difficult stretch, with price returning to an area that has repeatedly played an...

Binance Withdrawals Top FTX Levels in November, but Crypto Liquidity Defies Panic
Binance withdrawals surged into the billions after a record-breaking $6.3 billion hack, bringing back memories of FTX’s November 2...

Ethereum Whale Buys $63 Million in ETH: Smart Money Calling a Bottom?
Ethereum is attracting a fresh wave of buying as one big whale scooped up nearly $63 million worth of ETH during the latest market...

Elon Musk’s Grok AI Predicts Lighter Crypto to Flip Hyperliquid
Elon Musk’s AI bot has made an insanely controversial call. Grok AI predicts a potentially significant development for Lighter by...

Mark Zuckerberg’s Meta AI Predicts an XRP Explosion as Binance Resumes Withdrawals Following Hack
Something potentially massive could be coming for Ripple XRP, according to Mark Zuckerberg’s AI bot. Meta AI predicts that XRP cou...

Binance sees nearly $3.8 billion withdrawn in 10 hours after reopening
The massive withdrawal highlights significant trust issues in the crypto market, emphasizing the need for enhanced security and tr...