SUI Bulls Gear Up, Can They Push Through The $1.16 Ceiling?
SUI is gearing up for a critical move as bullish momentum builds, setting its sights on the $1.16 resistance level. After a period of consolidation, buyers are showing renewed interest, driving the price higher and spark...
Archive context
Older archive item. Useful for background and entity history, but not a fresh market-moving signal.

SUI is gearing up for a critical move as bullish momentum builds, setting its sights on the $1.16 resistance level. After a period of consolidation, buyers are showing renewed interest, driving the price higher and sparking hopes of a potential breakout. However, the question remains: can the bulls muster enough strength to overcome this key barrier, or will the $1.16 ceiling hold firm and stall further upside?
This analysis explores whether SUI’s bulls have the momentum to break through the critical $1.16 resistance level. We’ll examine key technical indicators, market trends, and potential scenarios to determine if SUI can sustain its recent upward movement or if it will face another setback.
Bullish Indicators: Are The Stars Aligning For A Break?On the 4-hour chart, SUI is showing strong positive momentum as it trades above the 100-day Simple Moving Average (SMA). The printing of multiple bullish candlesticks highlights solid buying interest and favorable market sentiment, indicating that a break above the $1.16 level could be on the horizon.
Additionally, the Relative Strength Index (RSI) on the 4-hour chart has climbed above the 50% mark and is currently at 69%. This upward movement suggests that upbeat momentum is strengthening, indicating that buying pressure is increasing. As the RSI approaches overbought territory, it may signal that a breakout could be imminent, with the potential for the price to push higher if the current trend continues.
Technical analysis on the 1-day chart shows that SUI is also making a bullish move toward the $1.18 resistance level after the short-term pullback, highlighted by the formation of a hammer candlestick. Furthermore, the price is trading above the 100-day SMA, reinforcing the positive market sentiment, with buyers potentially driving the price higher for a potential breakout.
Finally, the RSI signal line on the 1-day chart is trending above the 50% mark, currently at 64%. This suggests that SUI is still experiencing bullish pressure, with the potential for buyers to maintain their dominance and push the price higher.
Critical Levels To Watch: Support And Resistance Zones For SUISUI is approaching a key level that could determine its next move. A breakout above the $1.16 resistance level could signal a promising trend and open the path to higher targets, such as $1.44 and its all-time high of $2.18.
If the price is rejected at this level, SUI could find support near $0.8411. Should it fall below this support, the next potential stop might be the $0.3550 level, with further declines possibly leading to the exploration of additional key support zones.
SUI was trading at approximately $1.02 at the time of writing, reflecting a 15.84% increase. The cryptocurrency has a market capitalization of over $2.7 billion and a trading volume of $418 million. Over the past 24 hours, its market cap and trading volume have increased by 15.75% and 55.47%, respectively.
Why this matters
This cryptocurrency story adds another data point to the current market tape and is useful when read alongside nearby source coverage.
Original source
Read on NewsBTCRelated market context

Ethereum (ETH) Price Prediction: Whale Rotates $155M Into ETH as Longs Surge Near $2,500
Ethereum is trying to stabilize after another volatile stretch, with price returning toward the mid-$2,400 region while several po...

Solana outshines XRP with higher transactions and stablecoin usage: Motley Fool
Solana's superior network metrics and stablecoin usage may boost investor confidence, potentially impacting its market valuation a...

BNB Chain processes 1.51B transactions in Q3 as tokenized equity trading jumps 11x
BNB Chain's surge in tokenized equity trading highlights a shift towards decentralized finance, potentially reshaping traditional...

McRib Is Back, and Bitcoin’s Weirdest Bullish Indicator Lives On
Crypto proponents are once again entertaining the curious connection between McDonald’s McRib and bitcoin prices, as the fast-food...

Bitcoin Steadies Above $81,000 as Traders Eye Late-October Seasonality and Oil-Driven Macro Noise
Bitcoin steadies above $81,000 as oil volatility grips macro markets and Carson Group's Ryan Detrick flags late-October lows as a...
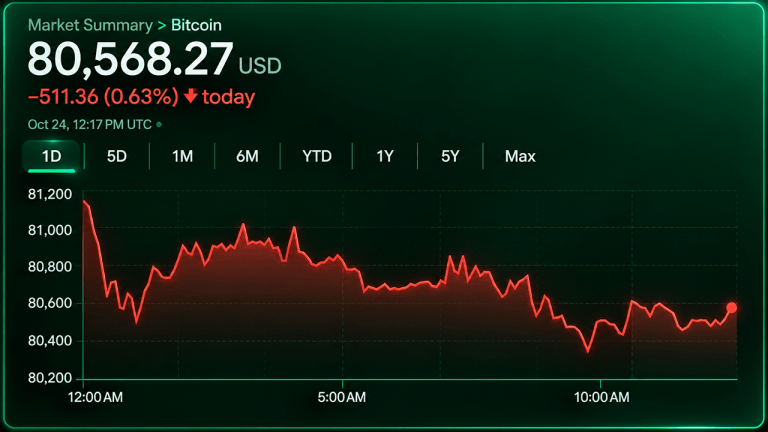
Bitcoin Price Faces $78K Threat as Sellers Hammer Key Support
Bitcoin’s price traded near $80,500 Saturday morning, Oct. 24, with sellers controlling the shorter time frames despite longer-ter...