Uniswap Price Continues Bearish Spell, Can It Move Past $6?
Uniswap price is consistently travelling southward on the one-day chart. UNI’s bulls have not been able to break past its immediate support, causing traders to lose confidence. Over the last 24 hours, Uniswap lost 4% of...
Archive context
Older archive item. Useful for background and entity history, but not a fresh market-moving signal.

Uniswap price is consistently travelling southward on the one-day chart. UNI’s bulls have not been able to break past its immediate support, causing traders to lose confidence.
Over the last 24 hours, Uniswap lost 4% of its value. In the past week, UNI surged 4% on the one-day chart.
The technical outlook of UNI remained mixed with some signals pointing toward the bears taking over the market.
The coin’s current support zone was between $5.60 and $5.00, respectively. The bulls have constantly attempted to break past the $5.94 level.
This has caused buyers to leave the market as sellers have entered the one-day price chart. As Bitcoin struggles at $19,000, most altcoins also attempt to move past their immediate price ceilings.
If the Uniswap price continues to witness less demand, then over the next trading sessions the coin can attempt to touch the closest support line.
At the moment, UNI is trading extremely close to the local support line and if buying strength doesn’t pick up, the coin will fall below the immediate support line.
Uniswap Price Analysis: One Day Chart Uniswap was priced at $5.69 on the one-day chart | Source: UNIUSD on TradingViewUNI was trading at $5.69 at the time of writing. The bulls have been defeated at the $5.94 resistance mark a couple of times.
Uniswap price can lose most of its gains if the coin continues to witness less demand. Overhead resistance stood at $5.94.
If UNI falls below that level, it will be reduced to $5.00. The amount of Uniswap traded in the last session fell, signalling that buying strength remained low. This indicated bearishness for UNI.
Technical Analysis Uniswap registered low buying strength on the one-day chart | Source: UNIUSD on TradingViewUNI, for most of this month, traded in the selling zone. This is because the coin has been unable to topple over the immediate resistance mark.
This is because of the low demand for Uniswap at the time of writing. The Relative Strength Index was below the half-line, and that was a sign of increased selling strength over buying strength.
It also depicted bearishness on the one-day chart. The Uniswap price was below the 20-SMA line, an indication of less demand. It also means that the sellers are currently driving the price momentum in the market.
Uniswap continued to display buy signal on the one-day chart | Source: UNIUSD on TradingViewUNI’s technical indicators depicted mixed signals on the one-day chart. The Moving Average Convergence Divergence measures the price momentum and overall price action of the altcoin.
MACD underwent a bullish crossover and formed green signal bars. These green signal bars were buy signal for the coin.
This also could mean that, with increased demand, UNI might make a price comeback in the upcoming trading sessions.
Bollinger Bands portray price volatility and fluctuations. The bands had opened up, meaning that the coin was about to witness price volatility.
Featured Image From Somag News, Charts From TradingviewWhy this matters
This cryptocurrency story adds another data point to the current market tape and is useful when read alongside nearby source coverage.
Original source
Read on NewsBTCRelated market context

Crypto News Today: Waller’s Rate-Hike Warning, MARA’s $1.1B Bitcoin Sale and USDC’s EU Deadline
Crypto news today is being shaped by three different pressures on digital money: a Federal Reserve official keeping a half-point r...

US Inflation Data Shakes Crypto Market as Bitcoin Breaks Below $73K Support
The decline intensified selling pressure across the cryptocurrency market, with Ethereum, XRP, and Solana also posting substantial...
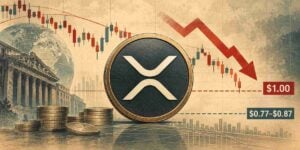
XRP Price Prediction: 25% Crash Risk Emerges as Historical Bearish Charts Point to $0.77
The XRP price traded around $1.04–$1.06 on November 10–11, 2026, following a sharp decline across the cryptocurrency market. With...

Coinbase Wins Federal Trust Charter, Launching National Trust Company
Key Takeaways: The OCC granted Coinbase final approval to form Coinbase National Trust Company. The federal charter confers on a u...

Trump Media (DJT) Pledges 73% of Its Bitcoin to an Options Program as $1 Billion Note Deadline Nears
Bitcoin Magazine Trump Media (DJT) Pledges 73% of Its Bitcoin to an Options Program as $1 Billion Note Deadline Nears Trump Media...

DeepSeek AI XRP Price Prediction: Could Ripple Really Go This High?
Ripple (XRP USD) is trading near recent lows, yet the setup for an extraordinary re-rating remains intact if one landmark catalyst...