Worldcoin Price Shows Key Support at $0.92 Amid Recent Volatility
Technical charts reveal indecision within the market, with buyers defending the lower boundary while sellers contest resistance near $1.10. Traders are closely monitoring this range for potential breakouts that could dic...
Archive context
Older archive item. Useful for background and entity history, but not a fresh market-moving signal.

Technical charts reveal indecision within the market, with buyers defending the lower boundary while sellers contest resistance near $1.10. Traders are closely monitoring this range for potential breakouts that could dictate the asset’s next directional move.
Consolidation Within Tight Trading Range Signals Market UncertaintyA chart shared on X post highlights WLD’s oscillation between support at approximately $0.92 and resistance near $1.10, depicting a classic range-bound structure.
This sideways movement reflects trader uncertainty and a balance of power between buyers and sellers, with multiple touches on both extremes but no decisive breakout. Such consolidations often precede increased volatility when the price eventually exits the range.
Source: X
Buyers have consistently stepped in around the $0.92 support, while selling pressure intensifies near $1.10 resistance, establishing a market equilibrium. Should this behavior persist, traders expect a volatility spike once a breakout or breakdown occurs. A close above $1.10 could trigger bullish momentum, whereas falling below $0.92 might lead to a sharp sell-off, making these boundaries critical for trend confirmation.
Short-Term Price Dynamics Suggest Correction and Key Support DefenseAdditionally, the BraveNewCoin data chart shows recent price movement where WLD declined from around $0.98 to $0.92, a drop of nearly 5%. This movement likely reflects a reaction to external market influences or profit-taking following an earlier surge above $1.00. The initial rally indicated robust buying interest, but the swift reversal points to short-term uncertainty or correction.
Source: BraveNewCoin
Volume analysis reveals heavier trading activity during the price ascent, followed by diminishing volume on the decline, suggesting that selling pressure was relatively brief. This reduction in volume during the pullback adds to the unclear direction, with traders awaiting clearer signals. The $0.92 level has emerged as a pivotal support; holding here could stabilize prices and set the stage for a rebound, while failure to defend it might invite further downside.
Technical Indicators Point to Mixed Signals Amid Oversold ConditionsOn the other hand, technical analysis with Bollinger Bands shows WLD trading near the lower band, typically an indication of oversold conditions and a possible buying opportunity if the price reverses upward.
However, confirmation via price action is necessary to validate a trend change. The MACD indicator reflects ongoing bearish momentum, as evidenced by a negative histogram, though the line’s proximity to the signal line suggests weakness but no outright downtrend.
Source: TradingView
This combination yields a mixed outlook: while the lower Bollinger Band signals potential support, the MACD does not yet confirm a reversal. Traders should watch closely for a bounce toward the Bollinger midline and a break above $1.00, which would reinforce bullish prospects. Failure to bounce could lead to a continuation of weakness, with the next major support positioned near $0.90 or below.
In summary, the coin price is currently consolidating above important support at $0.92 amid recent volatility and mixed technical signals. The market awaits a breakout above $1.10 or a breakdown below $0.92 to clarify the token’s near-term trend. Investors and traders should monitor volume and momentum indicators carefully as this range-bound phase approaches its resolution.
Why this matters
This research story adds another data point to the current market tape and is useful when read alongside nearby source coverage.
Original source
Read on Brave New CoinRelated market context

XRP Price Prediction: Elliott Wave Setup Points to $3 as XRP Nears a Potential $2 Breakout
XRP Price Prediction: Elliott Wave Setup Points to $3 as XRP Nears a Potential $2 Breakout XRP is approaching a critical technical...

Bitcoin’s weekend rebound faces an $80,400 test after nearly $730 million in ETF outflows
Bitcoin traded near $82,900 in PerpFinder’s Oct. 10, 09:36 UTC snapshot, with traders watching whether the weekend rebound brings...
Bitcoin Traders Stack $4.5 Billion in Calls as $95K Bets Take Shape
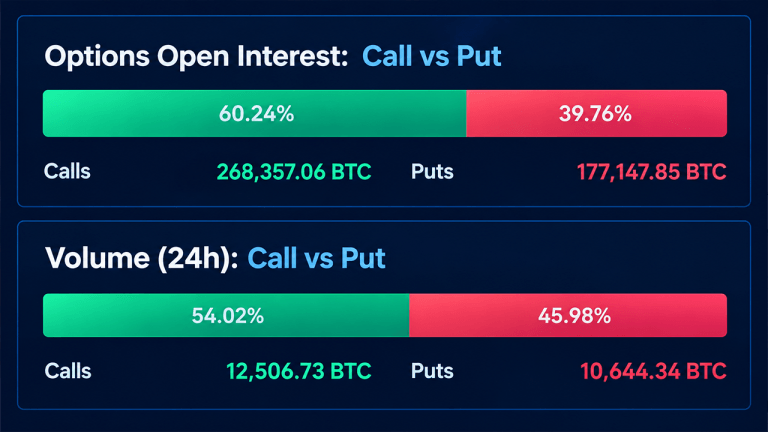
Bitcoin’s options market is sending a curious message. With bitcoin trading above $82,000, calls account for 60.24% of outstanding...

Ledger hack scare nears $90 million as Tether moves to freeze stolen USDT
Suspected Ledger wallet thefts are approaching $90 million as Tether freezes USDT stablecoin linked to the incident, according to...

Samsung Wallet Brings USDC to 82M Galaxy Devices With Coinbase, Solana and Sui Support
Key Takeaways: Samsung Wallet will support 82 million U.S. Galaxy to add transfers on USDC. Coinbase will keep USDC in their Coinb...

Bitcoin Price Briefly Reclaims $81,000 as Liquidations Top $1 Billion
Bitcoin price fell for a fourth consecutive day, briefly slipping below $81,000 before rebounding, as the total crypto market cap...