
The unabridged Market’s Compass Emerging Markets Country ETF Study will be published next Monday but last week’s explosive positive price action in the iShares MSCI Emerging Markets ETF or EEM, and a number of EM Country ETFs is noteworthy prompting me to publish this brief interim report. Paid subscribers are familiar with my Objective Technical Rankings, what follows is an explanation for those who are not.
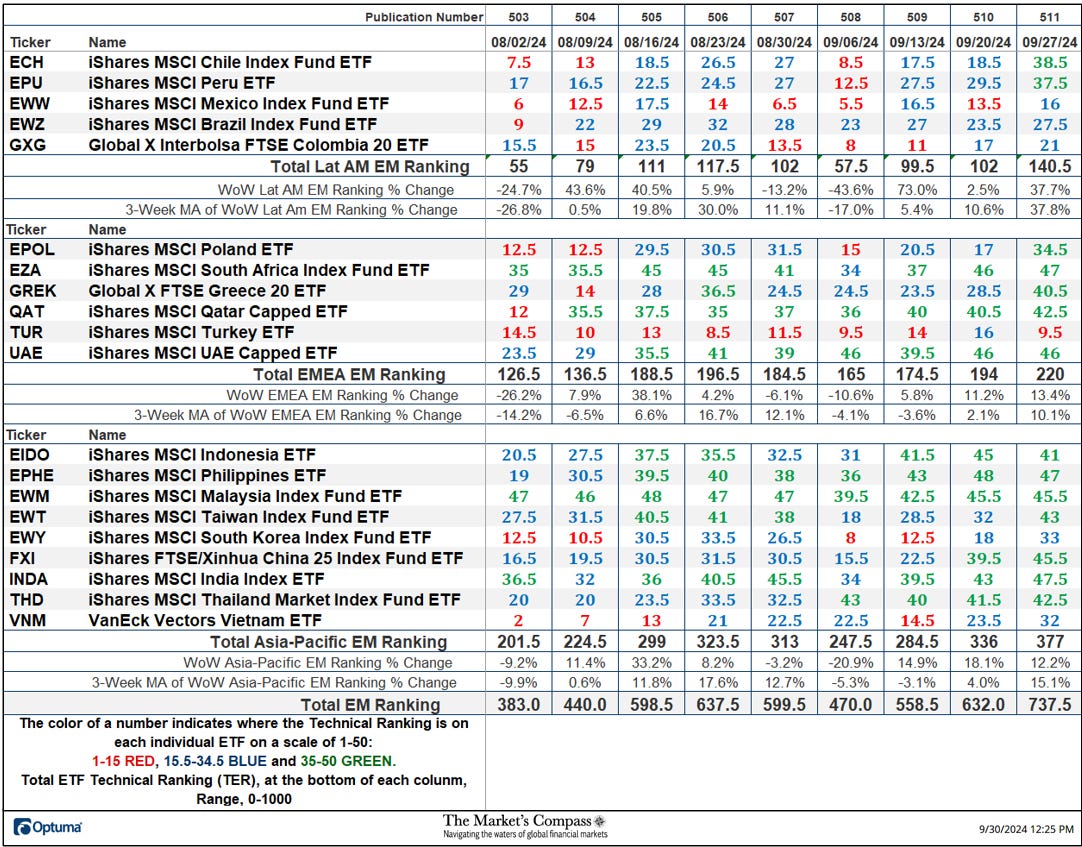
Last Week’s and 8 Week Trailing Technical Rankings of the Individual EM ETFsThe Excel spreadsheet below indicates the weekly change in the Technical Ranking (“TR”) of each individual ETF. The technical ranking or scoring system is an entirely quantitative approach that utilizes multiple technical considerations that include but are not limited to trend, momentum, measurements of accumulation/distribution and relative strength. If an individual ETFs technical condition improves the Technical Ranking TR rises and conversely if the technical condition continues to deteriorate the TR falls. The TR of each individual ETF ranges from 0 to 50. The primary take away from this spread sheet should be the trend of the individual TRs either the continued improvement or deterioration, as well as a change in direction. Secondarily, a very low ranking can signal an oversold condition and conversely a continued very high number can be viewed as an overbought condition, but with due warning, over sold conditions can continue at apace and overbought securities that have exhibited extraordinary momentum can easily become more overbought. A sustained trend change needs to unfold in the TR for it to be actionable. The TR of each individual EM ETF in each of the three geographic regions can also reveal comparative relative strength or weakness of the technical condition of the select ETFs in the same region.
Last week The Total EM Technical Ranking or TEMTR rose by +16.69% to 737.5 from 632 the week before marking the fourth week of gains in the TEMTR. The Total Lat/AM EM Ranking rose the most of the three geographic regions by rising 37.7% to 140.5 from 102 two weeks ago. In second place was the Total EMEA EM Technical Ranking which rose 13.4% to 220 from 194. The Total Asia-Pacific EM Ranking rose 12.2% to 377 from 336.
The EEM with the Total ETF Ranking “TER” OverlaidThe Total ETF Ranking (“TER”) Indicator is a total of all 20 ETF rankings and can be looked at as a confirmation/divergence indicator as well as an overbought oversold indicator. As a confirmation/divergence tool: If the broader market as measured by the iShares MSCI Emerging Markets Index ETF (EEM) continues to rally without a commensurate move or higher move in the TER the continued rally in the EEM Index becomes increasingly in jeopardy. Conversely, if the EEM continues to print lower lows and there is little change or a building improvement in the TER a positive divergence is registered. This is, in a fashion, is like a traditional A/D Line. As an overbought/oversold indicator: The closer the TER gets to the 1000 level (all 20 ETFs having a TR of 50) “things can’t get much better technically” and a growing number individual ETFs have become “stretched” the more of a chance of a pullback in the EEM. On the flip side the closer to an extreme low “things can’t get much worse technically” and a growing number of ETFs are “washed out technically”, a measurable low is close to being in place and an oversold rally will likely follow. The 13-week exponential moving average, in red, smooths the volatile TER readings and analytically is a better indicator of trend.
After months of non-confirmation of new recovery price highs in the EEM, last week the Total ETF Ranking registered the highest reading since January 2021 and in doing so, marked an unquestionable confirmation of last week’s recovery high from the 2022 lows. What follows is a second Weekly Chart and the technical comments that I made on social media yesterday…
The iShares MSCI Emerging Markets Index Fund or EEM caught a swift kick higher last week! That was thanks in part (see insert) to a sharp rally in the SPDR S&P Emerging Asia/Pacific ETF (GMF) members and in particular Chinese equities (well we all know what that was about) and a turn in the Lat/Am ETFs. Nonetheless the EEM overtook resistance at the 50% Internal Line (violet dashed line) of the Standard Pitchfork (violet P1 through P3) which had capped rally attempts twice before and closed the week just below resistance at the Upper Parallel of the Pitchfork (solid violet line). The EEM may have to retrace a portion of last week's impulsive 3rd wave rally and even though it is currently overbought it appears that it is on its way to higher price levels and potentially resistance at the $50 level.
To receive the three unabridged ETF Studies that include the Market’s Compass U.S. Index and Sector Study, The Developed Market’s Country ETF Study, and the Emerging Markets Country ETF Study that track the technical condition of over 70 different ETFs and are published every Monday and the Market’s Compass Crypto Sweet Sixteen Study which is published every Sunday, become a paid subscriber at…
The Market's Compass Technical ViewUsing Technical Analysis to Navigate the Waters of the Global Financial MarketsThe charts are courtesy of Optuma whose charting software enables anyone to visualize any data including my Objective Technical Rankings.
For readers who are unfamiliar with the technical terms or tools referred to in the comments on the technical condition of the EEM can avail themselves of a brief tutorial titled, Tools of Technical Analysis or the Three-Part Pitchfork Papers that is posted on The Markets Compass website…
https://themarketscompass.com