The Markets Compass Developed Markets Country ETF Study
This is the second publication of the Market’s Compass Developed Markets ETF Study to be published in our Substack Blog that will highlight the technical changes of the 22 DM ETFs that we track on a weekly basis. Past pu...
Archive context
Older archive item. Useful for background and entity history, but not a fresh market-moving signal.
This is the second publication of the Market’s Compass Developed Markets ETF Study to be published in our Substack Blog that will highlight the technical changes of the 22 DM ETFs that we track on a weekly basis. Past publications can be accessed via our Substack Blog https://themarketscompass.substack.com/, The Market’s Compass website https://themarketscompass.com/ or by contacting me directly at https://[email protected].
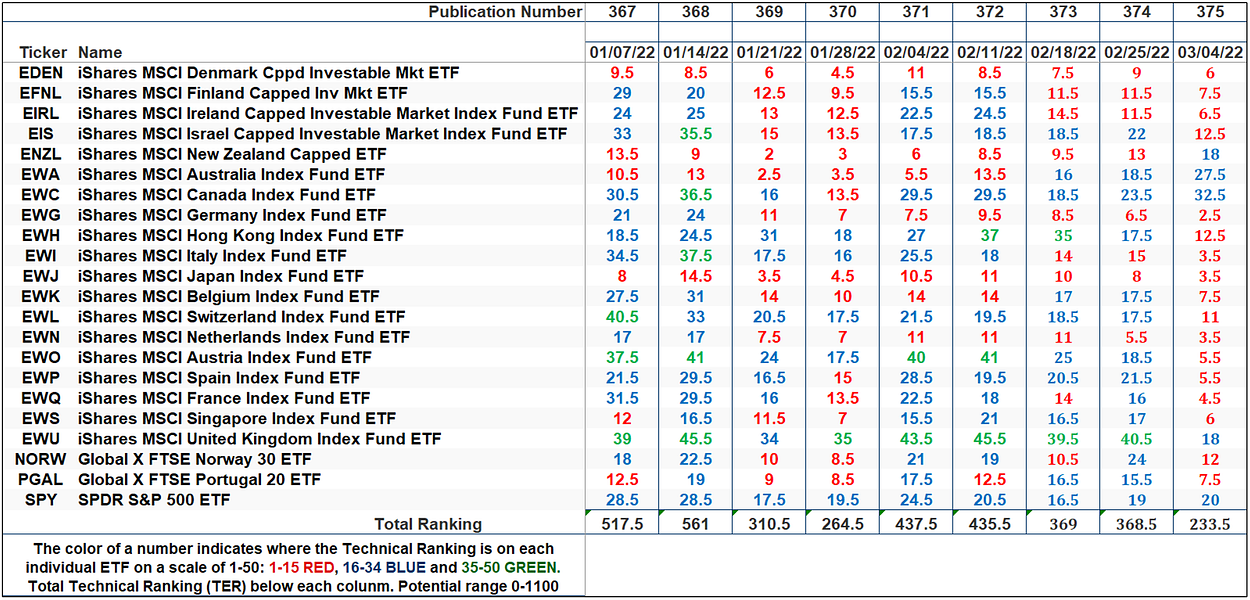
This Week’s and 8 Week Trailing Technical Rankings of Individual ETFs
The Excel spreadsheet below indicates the weekly change in the Technical Ranking (“TR”) of each individual ETF. The technical ranking or scoring system is an entirely quantitative approach that utilizes multiple technical considerations that include but are not limited to trend, momentum, measurements of accumulation/distribution and relative strength. If an individual ETFs technical condition improves the Technical Ranking TR rises and conversely if the technical condition continues to deteriorate the TR falls. The TR of each individual ETF ranges from 0 to 50. The primary take away from this spread sheet should be the trend of the individual TRs either the continued improvement or deterioration, as well as a change in direction. Secondarily a very low ranking can signal an oversold condition and conversely a continued very high number can be viewed as an overbought condition but with due warning over sold conditions can continue at apace and overbought securities that have exhibited extraordinary momentum can easily become more overbought. A sustained trend change needs to unfold in the TR for it to be actionable.
The URTH with This Week’s Total ETF Ranking “TER” Overlayed
The Total ETF Ranking (“TER”) Indicator is a total of all 22 ETF rankings and can be looked at as a confirmation/divergence indicator as well as an overbought oversold indicator. As a confirmation/divergence tool: If the broader market as measured by the iShares MSCI World ETF (URTH) continues to rally without a commensurate move or higher move in the TER the continued rally in the URTH Index becomes increasingly in jeopardy. Conversely, if the URTH continues to print lower lows and there is little change or a building improvement in the TER a positive divergence is registered. This is, in a fashion, is like a traditional A/D Line. As an overbought/oversold indicator: The closer the TER gets to the 1100 level (all 22 ETFs having an individual Technical Ranking “TR” of 50) “things can’t get much better technically” and a growing number individual ETFs have become “stretched” the more of a chance of a pullback in the URTH. On the flip side the closer to an extreme low “things can’t get much worse technically” and a growing number of ETFs are “washed out technically” an oversold rally or measurable low is close to be in place. The 13-week exponential moving average in red, smooths the volatile TER readings and analytically is a better indicator of trend.
The Total Technical Ranking (“TER”) of the iShares MSCI World Index ETF, (URTH) fell to it lowest level in almost two years last week and has fallen from the week before reading of 368.5 to 233.50 and from the February 11th reading of 435.5 (the date of our last DM Markets Country ETF Study) publication. Considering the tragic escalating war in the Ukraine and the potential that it may expand geographically and the economic knock-on effects through out all of Europe the current technical condition of the Developed Markets Country ETFs and their individual TRs and in turn the TER is hardly a surprise. What we can say is that the TER is near a level that suggests a deep over sold condition but there is nary a signal that it has reached its terminus.
The Average “TR” Ranking of the 22 DM Markets Country ETFs
The Average Weekly Technical Ranking (“ATR”) is the average technical ranking of the 22 Developed Markets ETFs we track weekly and is plotted in the lower panel on the Weekly Candle Chart of the iShares MSCI World Index (URTH) presented below. Like the “TER”, it is a confirmation/divergence or overbought/oversold indicator.
The “ATR” of the 22 Developed Markets Country ETFs has continued to track lower over the past four weeks the ATR has fallen from 19.80 on February 11th to 16.77, 16.75 to 10.61 respectively, extending its downtrend. As can be seen above, both the shorter-term moving average (red line) and longer-term moving average (blue line) of the ATR are still retreating. That said the “ATR” has not reached an oversold extreme that we witnessed in December 2018 and has only just dropped below the March 2020 low. We would need to see a sustained reversal in the ATR and a rally in price back above the Cloud to suggest a recovery was unfolding.
The Week Over Week Change in the DM Markets Countries Technical Rankings
Four out of 22 Developed Markets Country ETFs we track registered improved TRs over the week and 18 declined with the average TR loss of -6.14. The two leading the ETFs in improvement were the iShares MSCI Australia Index Fund ETF (EWA) rising 9 to 27.5 from 18.5. The iShares MSCI Canada Index Fund ETF (EWC) also rose 9 to 32.5 from 23.5 marking the highest TR of the 22 ETFs (weekly charts and holdings are posted below). Note that the EWA registered a new TR low in January and MACD of the TR in the lower panel of the chart did not, marking a bullish divergence (purple dashed lines).
ETF Holdings data is courtesy of Bloomberg
EWA Holdings
EWC Holdings
The DM Country ETFs Weekly Absolute and Relative Price % Change*
*Does not including dividends
Only three of the 22 Developed Markets Country ETFs we track improved on an absolute basis last week led by the iShares MSCI New Zealand ETF (ENZL) up +2.53% followed by the aforementioned iShares Australia Index Fund ETF (EWA) up +2.27% and the iShares MSCI Canada Index Fund ETF (EWC) which rose +1.02%. Five DM Country ETFs outperformed the iShares MSCI World ETF (URTH) on a relative basis and 17 underperformed.
The Relative Return of the 22 DM Country ETFs vs. the URTH Index Year to Date*
*Does not including dividends
I invite our readers to contact me with any questions or comments at…[email protected]
Why this matters
This research story adds another data point to the current market tape and is useful when read alongside nearby source coverage.
Original source
Read on The Market's CompassRelated market context

Solana ETFs see $6M inflow, highest in two weeks, led by Bitwise fund
Solana ETFs saw $5.83 million in inflows, the highest in two weeks. Solana reaching $90 by July 2026 at 7.5% YES. The post Solana...

Solana tokenized equities hit $52M weekly lending record
Solana's tokenized equities hit a weekly lending record of $51.9 million. Solana reaching $90 by July 2026 is at 8% YES. The post...

Bitcoin ETFs Take in Nearly $1B in New Money — But What Will the Price Do?
Bitcoin Magazine Bitcoin ETFs Take in Nearly $1B in New Money — But What Will the Price Do? American investors have thrown fresh c...

A dense week ahead: Fed decision, Big Tech earnings, and month-end crypto expiry
TL;DR Fed, GDP, and PCE releases compress four rate signals into two consecutive days (July 29 and 30), potentially forcing rapid...

Bitcoin (BTC) Price Prediction: Can Bitcoin Break $67K as Wyckoff Re-Accumulation Hints at an $85K Rally?
The rebound has improved the short-term technical picture, but the Bitcoin price still faces several important hurdles before the...

Robinhood Chain’s onchain stock token market cap exceeds $20M weeks after launch
Robinhood Chain's onchain stock token market cap tops $20M within weeks of launch, driven by Nvidia, SpaceX, and Tesla tokens acro...