3 reasons XRP might drop to $1.60 in March
The XRP (XRP) daily chart registered its lowest candle close in 99 days on March 10. The altcoin dropped below the $2 support level but registered a short-term recovery of 12% on March 11. XRP 1-hour chart. Source: Coint...
Archive context
Older archive item. Useful for background and entity history, but not a fresh market-moving signal.

The XRP (XRP) daily chart registered its lowest candle close in 99 days on March 10. The altcoin dropped below the $2 support level but registered a short-term recovery of 12% on March 11.
XRP 1-hour chart. Source: Cointelegraph/TradingView
On the high time frame (HTF) charts, XRP must hold above its psychological level at $2, but other metrics suggest that a deeper drawdown is possible.
XRP markets lack buyers as futures flip bearishXRP price is currently down 37.1% from its all-time high of $3.40. When prices dipped by a similar percentage on Feb. 3, spot market bids quickly absorbed the selling pressure, pushing XRP above $2.50.
XRP’s spot and perpetual aggregated data. Source: aggr.trade
However, XRP‘s spot and perpetual markets were relatively bearish over the past week. Data from aggr.trade indicates that XRP’s spot cumulative volume delta (CVD) dropped by 50% in March.
A negative CVD means that there is more selling volume than buying. The current CVD value is -$408 million, which signals waning demand, with sellers taking control.
Likewise, futures traders are also turning bearish, with perpetual CVD dropping to -1.18 billion on March 11. XRP’s open interest-weighted funding rate has also turned significantly negative, which indicates more short positions were added over the past few days.
XRP funding rate chart. Source: CoinGlass
XRP whales continue selling spreeXRP’s volume bubble map showed a surge in activity toward the end of February. Ki-Young Ju, CryptoQuant founder, observed that this uptick aligned with an ongoing distribution phase for XRP.
Distribution refers to a period in the market cycle when large investors slowly offload their positions to secure gains, usually happening close to the peak of an upward trend.
Related: Why is the XRP price down today?
Current data reveals that the distribution phase has intensified over the past seven days. Specifically, whale outflows, measured as a 30-day moving average, have steadily risen.
This increase suggests that large holders continued to offload their XRP positions, further driving the distribution trend.
XRP total whale flows. Source: CryptoQuant
Between March 4 and March 10, these large XRP holders offloaded roughly $838 million in positions. This significant sell-off reflects the ongoing bearish trend for XRP.
XRP price H&S pattern hints at $1.60 retestOn March 11, XRP’s 1-day chart closed below $2.05, which is the critical neckline of the daily head-and-shoulders pattern. This pattern has potentially strong bearish consequences when observed on a high time frame (HTF) chart.
XRP 1-day chart. Source: Cointelegraph/TradingView
Lower prices are likely if XRP fails to reclaim $2.05 as support, as illustrated in the chart above.
The immediate target zone for the XRP price remains between 0.5 and 0.618 Fibonacci retracement lines. Also known as the “golden zone,” the retest range lies between $1.90 and $1.60. The likelihood of retesting the 0.618 Fibonacci or $1.60 is high in the current bearish environment.
Failure to hold this range could lead to a retest of the long-term demand zone between $1.58 and $1.27.
This article does not contain investment advice or recommendations. Every investment and trading move involves risk, and readers should conduct their own research when making a decision.
Why this matters
This altcoin story adds another data point to the current market tape and is useful when read alongside nearby source coverage.
Original source
Read on CointelegraphRelated market context
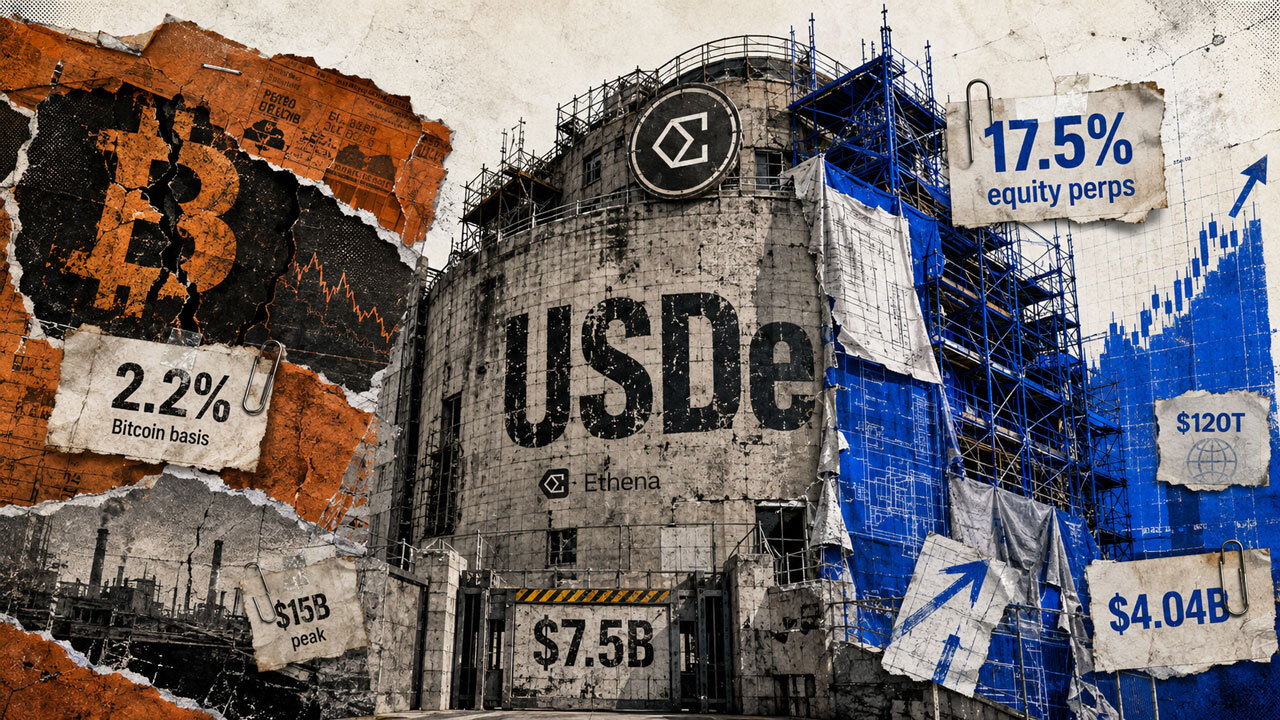
Ethena is targeting the $120 trillion Wall Street stock market to hunt yields 5x higher than Bitcoin
Ethena is expanding USDe into equity perpetual-basis trades, targeting funding yields more than five times higher than Bitcoin’s a...

Bitcoin miners are no longer pure crypto proxies and are morphing into high-performance computing hubs
Bitcoin gained 21.5% from the Aug. 17 close through Aug. 21, yet six of seven large US-listed miners finished the same trading str...

XRP Price Prediction: Ripple Faces Strongest Derivatives Selling Pressure
XRP price is having a more complicated prediction than that single red number suggests. Beneath the surface, derivatives desks are...

Bitcoin faces a new macro test as Fed Chair Kevin Warsh highlights sticky inflation metrics
Bitcoin has 54% as a new macro number to defend against, the share of the personal consumption expenditures basket that Federal Re...

Coinbase’s $104M US500 trading spike hits an early reality check
Coinbase US500 futures reached a $100 million milestone, giving the exchange an early test of whether a crypto-native trading mech...

Sui (SUI) Price Prediction: ETF Inflows and 100MA Support Strengthen $1.15 Outlook
Recent SUI price action has focused attention on the $0.73-$0.76 area, where several short- and medium-term moving averages are pr...