ADA Price Faces Key Hurdle, Can Cardano Surpass This To Start Fresh Rally?
Cardano (ADA) is attempting a recovery wave from the $0.4650 zone. ADA could start a fresh rally if there is a close above the $0.550 resistance. ADA price is moving higher from the $0.4650 zone. The price is trading bel...

Cardano (ADA) is attempting a recovery wave from the $0.4650 zone. ADA could start a fresh rally if there is a close above the $0.550 resistance.
- ADA price is moving higher from the $0.4650 zone.
- The price is trading below $0.570 and the 100 simple moving average (4 hours).
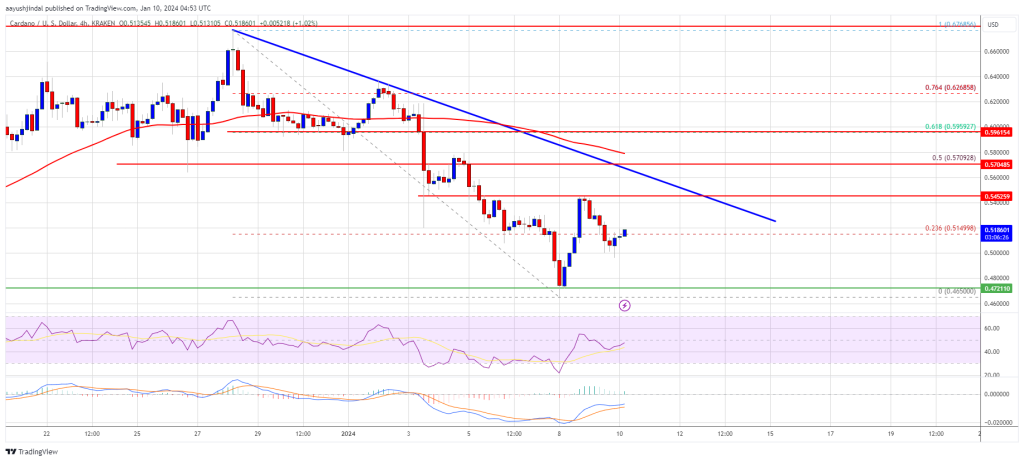
- There is a key bearish trend line forming with resistance near $0.545 on the 4-hour chart of the ADA/USD pair (data source from Kraken).
- The pair could accelerate higher if there is a clear move above $0.545 and $0.550.
After a strong rally, Cardano faced sellers near the $0.675 zone. ADA started a fresh decline below the $0.620 and $0.600 support levels, unlike Bitcoin and Ethereum.
There was a drop below the $0.550 support and the 100 simple moving average (4 hours). Finally, the price found support near the $0.4650 zone. The price is now attempting a fresh increase above the $0.500 resistance zone. The price tested the 23.3% Fib retracement level of the downward move from the $0.6768 swing high to the $0.4650 low.
ADA is now trading below $0.570 and the 100 simple moving average (4 hours). There is also a key bearish trend line forming with resistance near $0.545 on the 4-hour chart of the ADA/USD pair.
On the upside, immediate resistance is near the $0.532 zone. The first resistance is near $0.545 and $0.550. The next key resistance might be $0.570 or the 50% Fib retracement level of the downward move from the $0.6768 swing high to the $0.4650 low.
Source: ADAUSD on TradingView.com
If there is a close above the $0.570 resistance, the price could start a strong rally. In the stated case, the price could rise toward the $0.620 region. Any more gains might call for a move toward $0.650.
Another Decline in ADA?If Cardano’s price fails to climb above the $0.545 resistance level, it could start a fresh decline. Immediate support on the downside is near the $0.500 level.
The next major support is near the $0.465 level. A downside break below the $0.465 level could open the doors for a test of $0.432. The next major support is near the $0.420 level.
Technical Indicators
4 hours MACD – The MACD for ADA/USD is losing momentum in the bearish zone.
4 hours RSI (Relative Strength Index) – The RSI for ADA/USD is now below the 50 level.
Major Support Levels – $0.500, $0.465, and $0.432.
Major Resistance Levels – $0.532, $0.545, and $0.570.
Original source
Read on NewsBTCRelated market context

Bitcoin Stabilizes Near Key Zone, But Glassnode Warns Capital Flows Remain Weak
Bitcoin’s rebound from the $60,000 area has given bulls something to work with, but Glassnode’s latest market read suggests the re...

Ethereum Price Prediction: ETH is Still Below Its 200 Week SMA, and Tom Lee Buying Spree Might End Soon
Ethereum price is trading above $1,700 after running for 5% today, and even our prediction model is calling for more leg higher. H...

Ethereum News: Last Chance to Buy Ethereum Under $2K? ETH USD Powers Up After Hormuz Peace Deal
In the latest Ethereum News, Ethereum ETH Price is trading at $1,739 up 4% in 24 hours, as risk assets catch a bid following the H...

BTC News Today: Bitcoin Climbs Toward $66K as Trump Reveals US-Iran Peace Deal
The renewed geopolitical optimism helped improve risk sentiment across financial markets, pushing Bitcoin back toward the $66,000...

Dogecoin (DOGE) Recovery Gains Traction—Can It Unlock Bigger Gains?
Dogecoin started a fresh increase from the $0.0850 zone against the US Dollar. DOGE is now facing hurdles near $0.090 and might ai...

Bitcoin Price and Crypto Stocks Surge as Iran Ceasefire, Strategy’s $100M Buy Collide With Fed Week
Bitcoin Magazine Bitcoin Price and Crypto Stocks Surge as Iran Ceasefire, Strategy’s $100M Buy Collide With Fed Week Bitcoin price...