ADA Price Prediction – 10% Surge In Two Days, Bulls Aim For $0.35
Cardano (ADA) started a fresh increase above the $0.30 resistance. ADA is outperforming Bitcoin and might aim for a move toward the $0.35 resistance. ADA price regained strength for a move above the $0.265 and $0.280 lev...
Archive context
Older archive item. Useful for background and entity history, but not a fresh market-moving signal.

Cardano (ADA) started a fresh increase above the $0.30 resistance. ADA is outperforming Bitcoin and might aim for a move toward the $0.35 resistance.
- ADA price regained strength for a move above the $0.265 and $0.280 levels against the US dollar.
- The price is trading above $0.30 and the 100 simple moving average (4 hours).
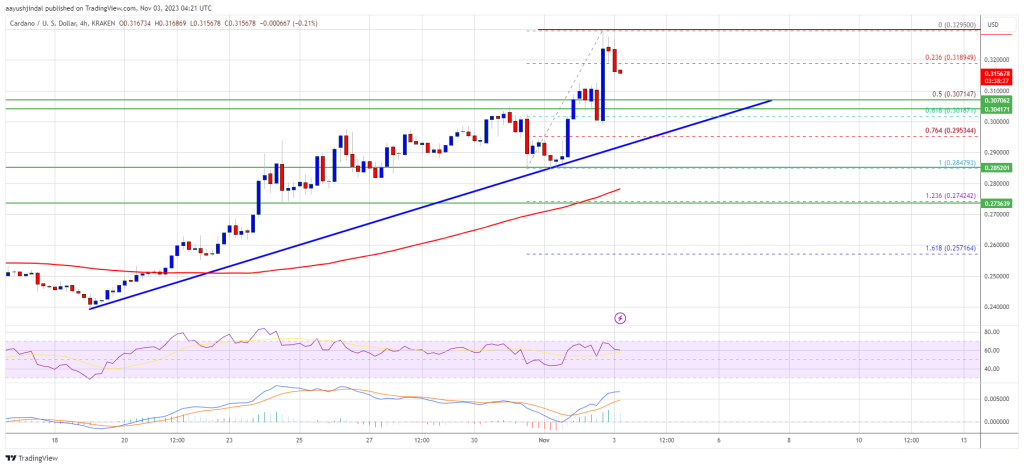
- There is a key bullish trend line forming with support near $0.3050 on the 4-hour chart of the ADA/USD pair (data source from Kraken).
- The pair must stay above the $0.308 support to start a fresh increase in the near term.
After a couple of swing moves, Cardano was able to gain strength for a move above the $0.28 resistance. It rallied above the $0.30 resistance to move further into a positive zone. It is up over 10% in two days, outperforming Bitcoin and Ethereum.
A new multi-week high is formed near $0.3295 and the price is now consolidating gains. There was a minor correction below the 23.6% Fib retracement level of the upward move from the $0.2847 swing low to the $0.3295 high.
ADA is now trading above $0.30 and the 100 simple moving average (4 hours). There is also a key bullish trend line forming with support near $0.3050 on the 4-hour chart of the ADA/USD pair. The trend line is close to the 50% Fib retracement level of the upward move from the $0.2847 swing low to the $0.3295 high.
Source: ADAUSD on TradingView.com
On the upside, immediate resistance is near the $0.3280 zone. The first resistance is near $0.332. The next key resistance might be $0.350. If there is a close above the $0.350 resistance, the price could extend its rally. In the stated case, the price could rise toward the $0.385 resistance zone.
Are Dips Supported in ADA?If Cardano’s price fails to climb above the $0.328 resistance level, it could continue to move down. Immediate support on the downside is near the $0.310 level.
The next major support is near the $0.308 level and the trend line. A downside break below the $0.308 level could open the doors for a sharp fresh decline toward $0.285. The next major support is near the $0.274 level.
Technical Indicators
4 hours MACD – The MACD for ADA/USD is losing momentum in the bullish zone.
4 hours RSI (Relative Strength Index) – The RSI for ADA/USD is now above the 50 level.
Major Support Levels – $0.310, $0.308, and $0.285.
Major Resistance Levels – $0.328, $0.332, and $0.350.
Why this matters
This altcoin story adds another data point to the current market tape and is useful when read alongside nearby source coverage.
Original source
Read on NewsBTCRelated market context

Ethereum (ETH) Price Prediction: ETH Holds Near $1,780 as Bulls Eye $1,860–$1,950, but $1,609 Remains Key Invalidation
Ethereum price is trading near $1,779 after a mixed 24-hour session, according to Brave New Coin data. ETH is down around 0.76% on...

Bitcoin (BTC) Price Prediction: BTC Holds $63K Support—Can Rising Active Addresses Offset Bearish Technical Signals?
Although the BTC price has remained near a key support zone, recent chart signals and Strategy’s sale of a portion of its Bitcoin...

The CLARITY Act Missed Its July 4 Deadline. Is Crypto Screwed?
There is a version of 2026 in which the United States finally settled the question that has defined a decade of crypto litigation...

Sui DeFi TVL Breaks $1 Billion As Move-Based Chains Fight For Liquidity
Sui has crossed the $1 billion total value locked mark on DeFiLlama, giving the Move-based network a clearer claim to serious DeFi...

Bitmine’s Tom Lee ties ether strength to Clarity Act odds as treasury nears 5% of Ethereum’s total supply
Bitmine acquired 42,197 ether worth an estimated $74 million last week, lifting its treasury to over 5.7 million ETH.

XRP Price Prediction: Volume and ETF Inflow Send Ripple Token Higher
XRP price pushed above the $1.14 resistance area after buyers stepped in with heavy volume and bullish prediction. The token climb...