Altcoin Liquidity Crunch: 83% Of Crypto Tokens Slip Into Bear Trend
Altcoin breadth on Binance has deteriorated sharply, with a large majority of tokens now trading below a widely watched long-term trend level, an exhaustion signal that CryptoQuant contributor Darkfost frames as a liquid...
Archive context
Older archive item. Useful for background and entity history, but not a fresh market-moving signal.

Altcoin breadth on Binance has deteriorated sharply, with a large majority of tokens now trading below a widely watched long-term trend level, an exhaustion signal that CryptoQuant contributor Darkfost frames as a liquidity problem as much as a price problem.
In a post on X, Darkfost (@Darkfost_Coc) shared a CryptoQuant chart tracking the share of Binance-listed altcoins trading below their 50-week moving average alongside Bitcoin’s price. His headline claim: “LIQUIDITY CRUNCH PUSHES 83% OF ALTCOINS INTO BEAR TREND,” arguing that most investors exposed to non-Bitcoin, non-stablecoin assets are “now in significant difficulty,” particularly those still holding positions.
Altcoin Breadth Breaks Down On BinanceDarkfost’s chart, titled “Altcoins performance (Binance)”, shows the percentage of altcoins below the 50-week moving average rising back into historically stressed territory. In his latest read, 83% of Binance altcoins are below that threshold, a sign that weakness is not isolated to a handful of names but spread across the tape.
He also pointed to an even more extreme episode earlier this month. “Since the end of the bear market in 2023, a new record was set on February 7, with more than 92% of altcoins on Binance trading below this key technical support,” he wrote, describing it as a post-2023-cycle high in downside participation.
That stands in stark contrast to the conditions seen during earlier upside phases. Darkfost noted that in March 2024 only 6% of Binance altcoins traded below the 50-week line, and in December 2024 the figure was 7%. Outside of those multi-month windows, he added, at least half of altcoins remained under the threshold, behavior he characterized as meaningfully different from the prior cycle’s breadth dynamics.
Darkfost framed the altcoin drawdown as inseparable from Bitcoin’s trend and the macro backdrop, suggesting that the market’s risk budget has tightened while altcoin supply has expanded.
“The market continues to be driven by BTC’s movements, which has been in a downtrend since October 2025 following an ATH at $126,000. At present, BTC’s momentum remains highly uncertain, with price still hovering at roughly 46% of its all time high. Rising geopolitical tensions, particularly between the US and Iran, alongside increasingly hawkish projections and tone from the Fed expressed in the latest FOMC minutes, are making the current environment especially challenging for highly volatile assets such as altcoins,” he wrote.
The chart itself marks BTC near the mid-$60,000 range, underscoring his broader point: in a regime where Bitcoin direction is unclear and macro inputs are hostile to duration and volatility, breadth in higher-beta tokens can deteriorate quickly and then stay impaired.
Why The 50-Week Line MattersDarkfost emphasized the 50-week moving average as a long-horizon filter used by market participants to separate corrective phases from structurally constructive ones. When a majority of tokens sit below it, rallies tend to be narrower, selection pressure rises, and “alt season” narratives become harder to sustain without a decisive shift in liquidity conditions.
He attributed the current setup to “the increase in altcoin supply across the broader crypto market combined with still constrained liquidity conditions,” a combination that can mechanically dilute marginal flows. In that environment, he argued, outperforming becomes less about broad beta exposure and more about understanding how market structure has changed.
At press time, the total crypto market cap excluding Bitcoin stood at $943.46 billion.
Why this matters
Bitcoin is showing up inside the Market Structure theme, so this story is worth tracking for follow-through rather than treating it as a one-off headline.
Original source
Read on NewsBTCRelated market context
BTC USD Recovering: Why is The Crypto Market Going Up Today, July 2nd?
After a rough June, the crypto market finally found its footing today. BTC USD climbed back above $60,000, while the total crypto...

Tether freezes 134 ISIS terror wallets as stablecoins now sit inside the sanctions machine
ISIS-K, the Islamic State affiliate active across Afghanistan, Pakistan, and parts of Central Asia, had USDT balances frozen on 13...

Robinhood Launches AI-Native Chain, Stock Tokens in 120+ Countries and 7% Crypto Yield
Key Takeaways: Robinhood Chain public mainnet is now live, bringing an AI-native Layer 2 network for DeFi and tokenized assets. In...
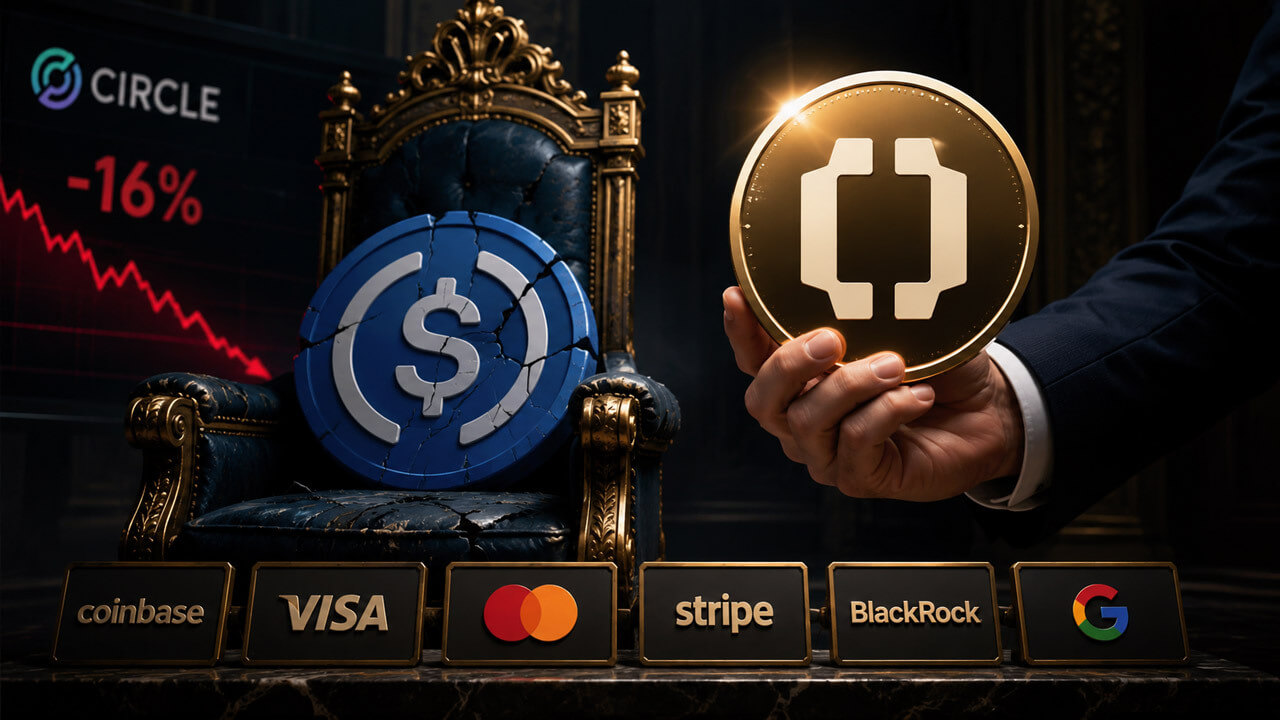
Coinbase helped build USDC – Why is it now backing the stablecoin trying to replace it, Open USD?
The stablecoin market has long rewarded the companies that issue digital dollars. They take in customer cash, hold reserves in sho...

Bitcoin Reclaims $61,000 as Dovish Inflation Outlook Softens Market Fear
The headline number is useful, but the real story is what it says about positioning. Bitcoin Reclaims $61,000 as Dovish Inflation...

XRP Ledger Lending Amendments Face 80% Validator Hurdle as Institutional Credit Layer Takes Shape
Ripple has formally proposed two XRPL amendments, XLS-65 and XLS-66, that would embed fixed-term institutional credit infrastructu...