Analyst Says Solana At Risk Of Pullback: Here Is The Target
An analyst has explained how Solana may be at risk of a correction based on the data of two SOL technical indicators. Solana Has Recently Observed The Formation Of Two Bearish Signals In a new post on X, analyst Ali has...
Archive context
Older archive item. Useful for background and entity history, but not a fresh market-moving signal.

An analyst has explained how Solana may be at risk of a correction based on the data of two SOL technical indicators.
Solana Has Recently Observed The Formation Of Two Bearish SignalsIn a new post on X, analyst Ali has discussed why SOL could be at risk of seeing a retracement shortly. The analyst has referred to two technical indicators for the coin: the TD Sequential and RSI.
The first of these, the Tom Demark (TD) Sequential, is a metric generally used for spotting probable reversal points in any asset’s price. The indicator has two phases, the first of which is a nine-candles-long “setup” phase.
When nine candles of the same polarity are in following a reversal in the price, the TD Sequential setup is said to be complete, and the asset could be assumed to have reached a likely point of a trend shift.
Naturally, if the candles are green, the setup’s completion would point towards a top, while red candles would imply a bottom formation. Once the setup is over, a thirteen-candles-long countdown phase starts. At the end of these thirteen candles, another probable change of direction happens for the chart.
According to Ali, a setup phase has recently formed for Solana. Below is the chart shared by the analyst that shows this TD Sequential pattern in the weekly price of the cryptocurrency.
The graph shows that the TD Sequential setup has recently been completed with green candles, implying that the price may have already reversed toward a bearish trend.
In the same chart, Ali has also attached the data for the second relevant indicator: the Relative Strength Index (RSI). The RSI is a momentum oscillator that keeps track of the speed and magnitude of the recent changes in an asset’s price.
This indicator determines whether the asset is undervalued or overvalued at the moment. When the metric has a value greater than 70, it can be a sign that the asset is overbought, while it being under the 30 mark suggests an oversold condition.
As is apparent from the graph, the Solana RSI recently broke above the 70 mark and has remained inside the territory, suggesting that SOL has been overvalued recently.
This would mean that two bearish signals are looming over the cryptocurrency’s head right now. “A spike in profit-taking could trigger a retracement to $47.6,” says the analyst. From the current price, such a potential correction to $47.6 would mean a drawdown of over 20%.
Solana’s fate may yet be averted; however, as the analyst explains, “SOL would have to print a weekly candlestick close above $68.4 to invalidate the bearish outlook and aim for $108.”
SOL PriceSolana had rallied above the $65 mark yesterday, but the asset has already seen a pullback as it’s now trading around $60.
Why this matters
This altcoin story adds another data point to the current market tape and is useful when read alongside nearby source coverage.
Original source
Read on NewsBTCRelated market context

Bitcoin (BTC) Price Prediction: BTC Turns $79K into Support as Risk-On Signal Points to Fresh Rally Toward $100K
The move has also coincided with a shift in Glassnode’s Bitcoin Vector framework. The proprietary model moved into a Risk-On regim...

Zcash breaks $1,000 as its spot ETF crosses $400 million in assets
Zcash broke above $1,000 on Sept. 4, pushing the asset value of Grayscale’s recently listed ZCSH ETF past $400 million less than t...

Hyperliquid (HYPE) Price Prediction: New ATH Near $90 and Whale Accumulation Strengthen $100 Breakout Outlook
Hyperliquid reached roughly $89.60 on September 6, according to exchange market data, while its 24-hour volume remained above $1 b...

Solana’s weekly ETF inflows fell 97% while CME funds became less net short
Solana’s US ETF inflows fell about 97% in the week ending Sept. 4, leaving the funds with a small positive balance as Bitcoin’s al...
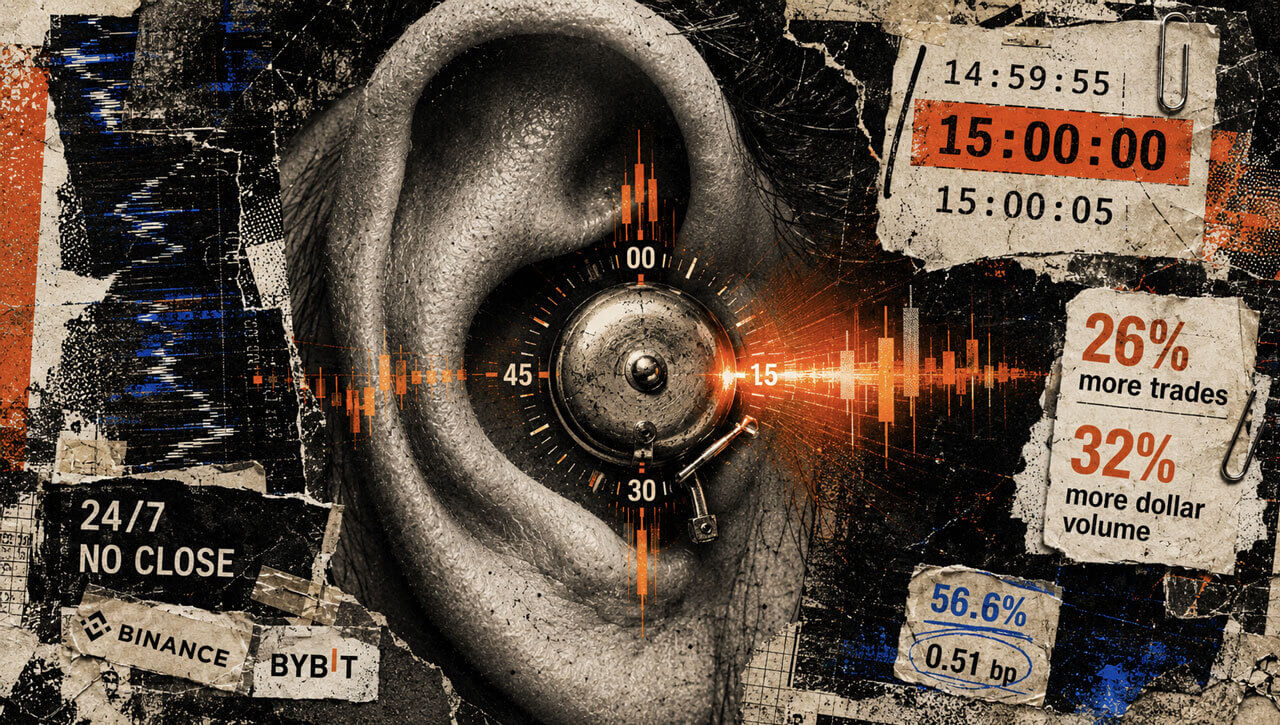
Inside the 15-minute trading pulse that moves $14 billion in Bitcoin perpetual futures
At 14:59:59 UTC, Bitcoin perpetual futures look like any other electronic market, with prices flickering and orders flowing from t...

Token Terminal adds coverage for five tokenized stocks on Solana with $1.7M market cap
Token Terminal's expansion enhances transparency and comparability in the fragmented tokenized asset market, potentially boosting...