Analyst Teases $7.50 XRP Moonshot But Only After A Final Flush
Crypto analyst Charting Guy (@ChartingGuy) is mapping out a sharply asymmetric setup for XRP, arguing that the token is locked in a textbook Wyckoff reaccumulation and is “still NOT bearish in the slightest” despite a ye...
Archive context
Older archive item. Useful for background and entity history, but not a fresh market-moving signal.

Crypto analyst Charting Guy (@ChartingGuy) is mapping out a sharply asymmetric setup for XRP, arguing that the token is locked in a textbook Wyckoff reaccumulation and is “still NOT bearish in the slightest” despite a year of range-bound trading.
Why XRP Is Still Not BearishHis work is based on XRP/USD Bitstamp charts posted on X on 27 November 2025. On the weekly view, XRP trades around $2.23 after an 8–9% gain on the week, consolidating below the 2025 peak at approximately $3.317, which he marks as the 1.0 Fibonacci level. The retracement is drawn from the cycle low near $0.11400 up to that high, producing a ladder of levels that structure the entire thesis.
Key Fibonacci levels include 0.5 at about $0.61495, 0.618 at $0.91531, 0.702 just above $1.20 and, crucially, 0.786 at $1.61246. A broad highlighted band covers the prior 2021 high zone and this 0.786 cluster, roughly from the mid-$1s into the low-$2s. Charting Guy describes this as XRP “building support on prior cycle high as well as top of golden pocket,” referring to the 0.618–0.786 retracement area.
Above the 2025 high, he plots classic Fibonacci extensions: 1.272 at about $8.29661, 1.414 around $13.38940 and 1.618 near $26.63038. His immediate scenario, however, stops short of those levels, projecting a move toward roughly $7.50.
XRP Price Roadmap For 2026The detailed roadmap appears on a two-day XRP/USD chart overlaid with a Wyckoff schematic. The structure begins with a Preliminarily Supply (PSY) phase and a Buying Climax (BC) into the low-$3 zone, followed by a Secondary Test (ST) and an Automatic Reaction (AR) that defines the lower boundary of the range. Horizontal lines mark that floor near $1.61184, an intermediate band around $1.95, resistance at approximately $2.90 and the upper ceiling just above $3.30.
During mid-2025, XRP prints an “UT Phase B” upthrust into that $3+ resistance before rolling into a downward-sloping channel. The upper boundary of this channel, labeled “CREEK,” connects a series of lower highs, while the lower boundary guides price back toward the $1.61–1.70 support.
In the scenario path, XRP spikes down to test the blue horizontal at $1.61184. This move is annotated as the “SPRING” — Wyckoff’s final shakeout below range support. Price then rebounds to retake the $1.95 area, marked “TEST,” and establishes a higher low between roughly $2.00 and $2.20 as the first “LPS” (Last Point of Support).
From there, the schematic shows a decisive break of the descending “CREEK” trendline, the “JATC” or “Jump Across The Creek,” as XRP accelerates from around $2.20–2.30 through the $2.90 resistance. That breakout is followed by a “SOS” (Sign of Strength) above the former ceiling, with another LPS holding around the $2.90 region and confirming the flip of resistance into support.
The right edge of the 2D chart then projects a steep markup phase. XRP rallies from roughly $3.00 to just above $7.50 before stalling, even though it remains below the 1.272 weekly extension at $8.29661.
Alongside the charts, Charting Guy pushes back against bearish momentum narratives centered on the monthly RSI. He notes that the RSI peak occurred in January 2025 and “lost momentum ALL 2025 while XRP stayed sideways in a range and held its own,” calling this “a very textbook reaccumulation signal where indicators lose steam to reset and price stays stable.”
The technical message is unambiguous: as long as the $1.61–1.70 band holds, Charting Guy views XRP’s extended consolidation as preparation, not distribution—anticipating a final flush below $1.70, followed by a Wyckoff-style breakout sequence toward approximately $7.50.
At press time, XRP traded at $2.23.
Why this matters
This altcoin story adds another data point to the current market tape and is useful when read alongside nearby source coverage.
Original source
Read on NewsBTCRelated market context

Bitcoin’s rebound approaches the $85,000 zone where past buyers may sell
Bitcoin and Ethereum extended their weekend recovery, although on-chain indicators and derivatives positioning suggest the rebound...

Bitcoin falls below $82,000 as $120 million in crypto longs get liquidated
The rapid liquidation highlights the volatility and risks of leveraged trading, potentially deterring cautious investors and impac...

FTX’s former Bitcoin mining bet gets new life as parent raises €800 million for AI
SWI Group has raised €800 million to expand AI infrastructure, advancing its plan to repurpose FTX-backed Bitcoin miner Genesis Di...

State of TRON Q3 2026 Report Highlights $2.21 Trillion in Stablecoin Settlement Amid Network Activity Growth
Geneva, Switzerland, October 12, 2026 — TRON DAO, the community-governed DAO dedicated to accelerating the decentralization of the...
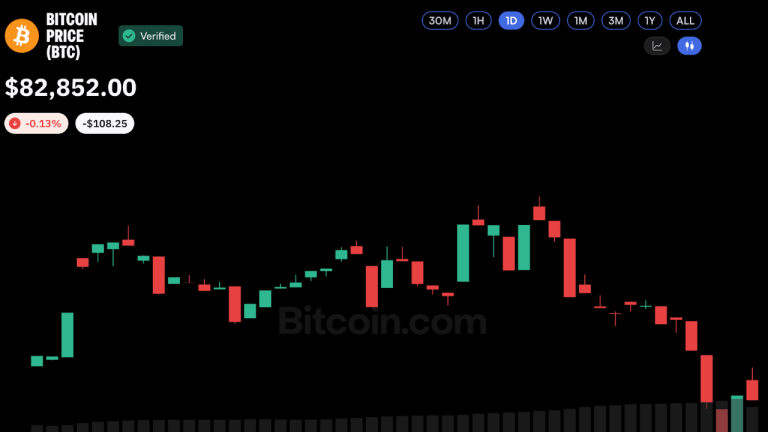
Bitcoin Price Defies $681M ETF Outflow as Oil Trades Above $100
Bitcoin is holding above $80,000 even as Brent crude trades above $100 amid renewed Middle East tensions. The resilience is notabl...

Bitcoin slips below $83,000, wiping out nearly $42 million in longs before the US open
Leverage-induced volatility highlights the risks in Bitcoin trading, emphasizing the need for cautious positioning and monitoring...