BNB Coin Price Hits Critical Support Level: Is a Rebound on the Horizon?
BNB price started a downside correction from the $585 zone. The price must stay above $570 to start a fresh increase in the near term. BNB price started a fresh decline after it failed to clear the $585 resistance zone....

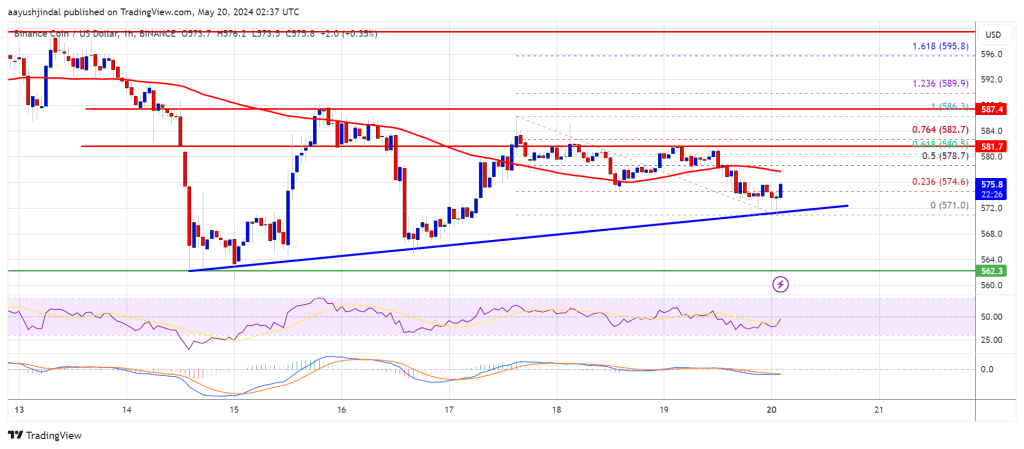
BNB price started a downside correction from the $585 zone. The price must stay above $570 to start a fresh increase in the near term.
- BNB price started a fresh decline after it failed to clear the $585 resistance zone.
- The price is now trading below $580 and the 100 simple moving average (4 hours).
- There is a key bullish trend line forming with support near $570 on the hourly chart of the BNB/USD pair (data source from Binance).
- The pair could start a fresh increase if it stays above the $570 support.
After a decent increase, BNB price struggled near the $585 resistance. As a result, there was a bearish reaction below the $580 support, like Ethereum and Bitcoin.
The price dipped below the $575 support and the 100 simple moving average (4 hours). It traded as low as $571 and is currently consolidating losses. There is also a key bullish trend line forming with support near $570 on the hourly chart of the BNB/USD pair.
There was a minor upward move above the $575 level. The price cleared the 23.6% Fib retracement level of the downward move from the $586 swing high to the $571 low. It is now trading below $580 and the 100 simple moving average (4 hours).
Immediate resistance is near the $578 level or the 50% Fib retracement level of the downward move from the $586 swing high to the $571 low. The next resistance sits near the $582 level.
A clear move above the $582 zone could send the price higher. In the stated case, BNB price could test $588. A close above the $588 resistance might set the pace for a larger increase toward the $600 resistance. Any more gains might call for a test of the $612 level in the coming days.
More Losses?If BNB fails to clear the $582 resistance, it could continue to move down. Initial support on the downside is near the $572 level and the trend line.
The next major support is near the $562 level. The main support sits at $550. If there is a downside break below the $550 support, the price could drop toward the $532 support. Any more losses could initiate a larger decline toward the $525 level.
Technical Indicators
Hourly MACD – The MACD for BNB/USD is losing pace in the bearish zone.
Hourly RSI (Relative Strength Index) – The RSI for BNB/USD is currently below the 50 level.
Major Support Levels – $572, $562, and $550.
Major Resistance Levels – $582, $588, and $600.
Original source
Read on NewsBTCRelated market context

Bitcoin Stabilizes Near Key Zone, But Glassnode Warns Capital Flows Remain Weak
Bitcoin’s rebound from the $60,000 area has given bulls something to work with, but Glassnode’s latest market read suggests the re...

Ethereum Price Prediction: ETH is Still Below Its 200 Week SMA, and Tom Lee Buying Spree Might End Soon
Ethereum price is trading above $1,700 after running for 5% today, and even our prediction model is calling for more leg higher. H...

BTC News Today: Bitcoin Climbs Toward $66K as Trump Reveals US-Iran Peace Deal
The renewed geopolitical optimism helped improve risk sentiment across financial markets, pushing Bitcoin back toward the $66,000...

Ethereum Research Proposal Targets Post-Quantum Wallet Security At Low Gas Cost
A new Ethereum Research proposal is putting post-quantum wallet security back in focus, outlining a practical way to verify quantu...

XRP Price Prediction: US-Iran Peace Deal Fuels 13% XRP Surge, Analysts Target $1.94 Retest
The latest move saw XRP price today reclaim the $1.28 level for the first time in nearly two weeks. Market participants pointed to...

XRP Price Analysis: Ripple Token Eyes 10% Gain with Flashing Bullish Pattern and ETF Inflows
XRP price posts 9% moves today from low $1.1 to $1.24, with a prediction that it could go even higher. Two independent tailwinds a...