BNB Price Back on Track: Can It Break $535 to Move Higher?
BNB price is recovering higher from the $500 support zone. The price is now showing positive signs and might aim for more upsides above $535. BNB price started a recovery wave from the $500 support zone. The price is now...

BNB price is recovering higher from the $500 support zone. The price is now showing positive signs and might aim for more upsides above $535.
- BNB price started a recovery wave from the $500 support zone.
- The price is now trading above $515 and the 100-hourly simple moving average.
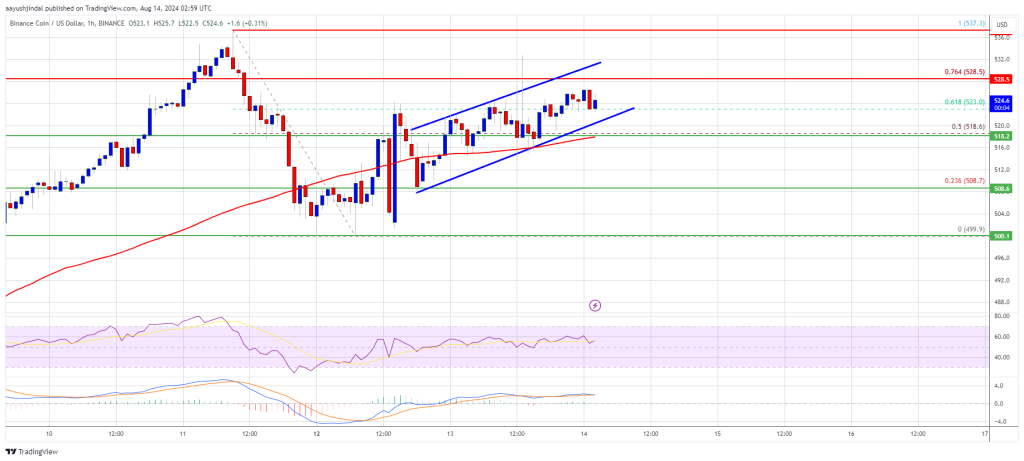
- There is a key rising channel forming with resistance at $528 on the hourly chart of the BNB/USD pair (data source from Binance).
- The pair could gain bullish momentum if it clears the $535-$538 resistance zone.
After forming a base above the $500 level, BNB price started a decent upward move like Ethereum and Bitcoin. The price cleared the $510 and $515 resistance levels to move into a short-term bullish zone.
The price surpassed the 50% Fib retracement level of the downward move from the $5376 swing high to the $499 low. It even cleared the $520 resistance. The price is now trading above $515 and the 100-hourly simple moving average.
It is now consolidating near the 61% Fib retracement level of the downward move from the $5376 swing high to the $499 low. On the upside, the price could face resistance near the $528 level. There is also a key rising channel forming with resistance at $528 on the hourly chart of the BNB/USD pair.
The next resistance sits near the $535 level. A clear move above the $535 zone could send the price higher. In the stated case, BNB price could test $550. A close above the $550 resistance might set the pace for a larger increase toward the $565 resistance. Any more gains might call for a test of the $580 level in the near term.
Another Decline?If BNB fails to clear the $535 resistance, it could start another decline. Initial support on the downside is near the $520 level. The next major support is near the $518 level.
The main support sits at $508. If there is a downside break below the $508 support, the price could drop toward the $500 support. Any more losses could initiate a larger decline toward the $480 level.
Technical Indicators
Hourly MACD – The MACD for BNB/USD is gaining pace in the bullish zone.
Hourly RSI (Relative Strength Index) – The RSI for BNB/USD is currently above the 50 level.
Major Support Levels – $518 and $508.
Major Resistance Levels – $528 and $535.
Original source
Read on NewsBTCRelated market context

Uranium Holds Above $85 as Mining ETF Rebounds From June Sell-Off
The latest charts display that the market is divided into stable physical prices and uranium shares trying to regain momentum afte...

Standard Chartered Says Bitcoin Bottomed Near $59,000 As Crypto Winter Ends
TL;DR Standard Chartered’s Geoffrey Kendrick reportedly says Bitcoin’s $59,000 area marked the cycle bottom. The note cites SpaceX...

Elon Musk SpaceX AI Predicts Incredible Bitcoin Price For Next 30 Days
Here is the thing about capitulation calls. They only sound smart in hindsight. Right now, with Bitcoin price scraping along the l...

Tether USDT Briefly Overtakes Ethereum in Market Cap: A $187B Wake-Up Call
For a few hours, earlier this week, Tether USDT stablecoin held a higher market cap than Ethereum, the first time that has happene...

Bitcoin price challenges $64,000 weekend wall – needing a breakout or risk a deeper correction
Bitcoin reclaimed $64,000 on June 12 and touched an intraday high of $64,301 in the same session that spot ETF flows finally flipp...

Bitcoin rises above $64,000 after Pakistan prime minister says Iran peace deal is near
Bitcoin traded above $64,000 on Saturday, supported by its strongest ETF inflows in a month and growing optimism around geopolitic...